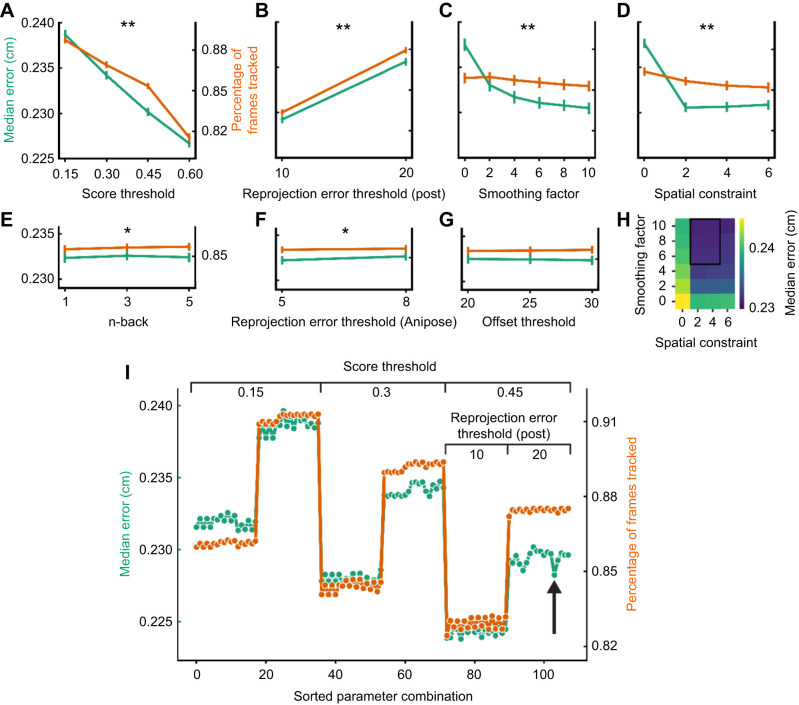
Fig. 2.
Anipose parameter sweep. (A) Median error (green) and percentage of frames tracked (orange) versus score threshold, averaged across the other parameters. Plots show mean±95% confidence interval of median errors. (B–G) Same for each of the tested parameters: post-processing reprojection error threshold (B), smoothing factor (C), spatial constraint (D), n-back (E), Anipose reprojection error threshold (F) and offset threshold (G). Plots are labeled with asterisks to indicate a large effect on both error and percentage of frames tracked (**log likelihood ratio Chi-squared statistic LR>>50, P<0.05) or a modest effect on one or the other (*LR<50, P<0.05). (H) Median error, represented by cell color, versus smoothing factor and spatial constraint. The combinations with lowest error are boxed. (I) Median error and percentage of frames tracked for 108 parameter sets with smoothing factor and spatial constraint set to 6 and 2, respectively. Results are sorted along the x-axis by score threshold first, post-processing reprojection error threshold second and n-back third. The arrow indicates the parameter set selected for further analysis.

