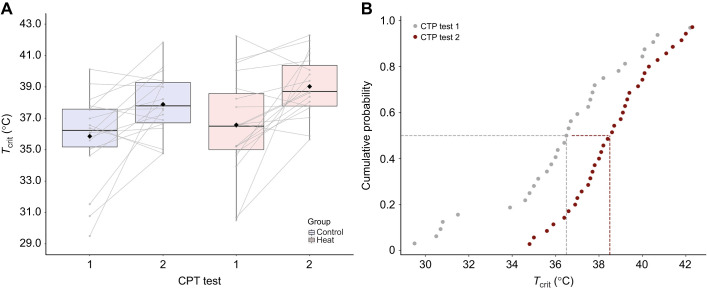
Fig. 2.
Experiment 1: changes in Tcrit from CTP test 1 to test 2. (A) Tcrit in control (n=18) versus heat-acclimation (n=19) groups from CTP test 1 to 2. There was no significant group by time interaction (P=0.68); instead, control and heat-acclimation groups experienced a similar change in Tcrit from CTP test 1 to test 2 (P<0.0001; +2.2°C mean increase in Tcrit). However, the heat-acclimation group tended to have a slightly higher Tcrit at test 2 by ∼1.1°C (i.e. P=0.086). Each boxplot outlines the 25th and 75th percentiles, the midline indicates each group's median Tcrit, while black diamonds indicate the mean Tcrit for each group. Gray lines indicate the change in each individual's Tcrit from CTP test 1 to test 2. (B) Extrapolation of results from experiment 1, showing the cumulative probability that an individual chosen at random has a Tcrit less than or equal to the temperature shown on the x-axis. For any given Tcrit, cumulative probability was less for individuals in CTP test 2 than in CTP test 1. The median Tcrit (the Tcrit at which cumulative probability was 0.5, represented by the dashed vertical lines) was lower for CTP test 1 than for CTP test 2.

