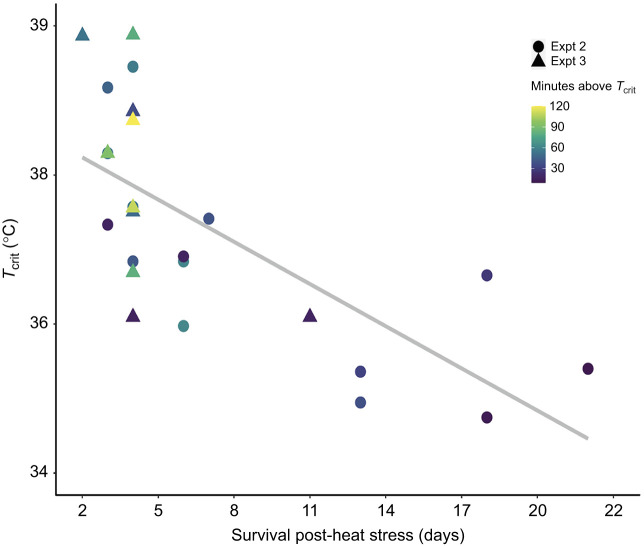
Fig. 5.
Experiments 2 and 3: survival time post-heat stress is based on absolute Tcrit and time spent above Tcrit. Of the mussels that died in experiment 2 and the control mussels that died in experiment 3 (n=25), the best predictors of mussel survival post-heat stress were an interaction term of Tcrit and the amount of time spent above Tcrit (R2=0.67, P<0.0001). The solid gray line indicates the line of best fit (see Results, Eqn 3). Each point represents an individual mussel, shaded to represent the amount of time they spent above Tcrit. Individuals from experiment 2 (38°C for 1 h) versus experiment 3 (40°C for 2 h) are denoted by circles and triangles, respectively.

