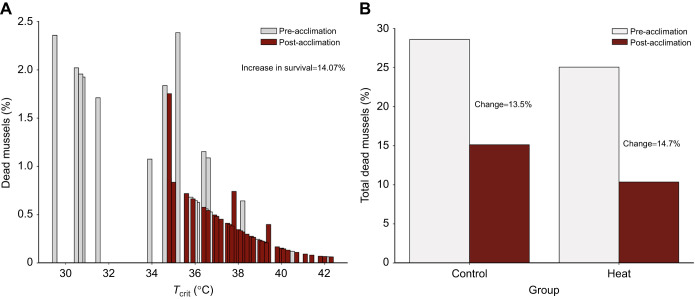
Fig. 6.
Extrapolation of laboratory results from experiment 1 mapped to long-term field data to estimate mussel survival pre- versus post-heat acclimation. Using the long-term field data from Helmuth et al. (2016), the exceedance probability for a given temperature was multiplied by the fraction of mussels that had a given Tcrit to get an estimate of the percentage of mussels that would likely die in the field if held for ≥10 min at that specific Tcrit (see Materials and Methods and Fig. S4 for further explanation). (A) Percentage of mussels estimated to die at a specific Tcrit pre-heat acclimation (n=37, CTP test 1) versus post-heat acclimation (n=37; CTP test 2). Post-heat acclimation, there was a loss in animals with a low (<35°C) Tcrit. (B) Summated data from A to estimate the total percentage of mussels that would die pre-heat acclimation (CTP test 1) versus post-heat acclimation (CTP test 2) for the control (n=18) versus heat (n=19) groups. The two groups had a similar improvement in survival after just the one CTP test (∼13.5% improvement for control versus ∼14.7% improvement for heat-acclimation groups).

