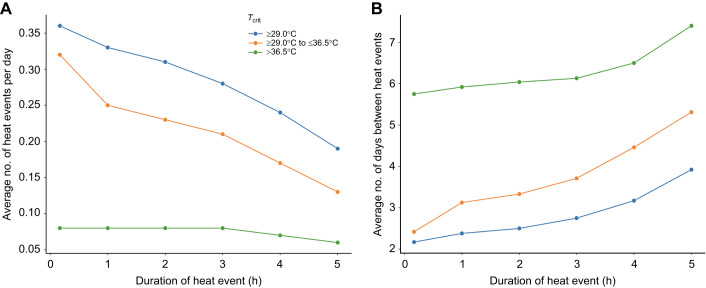
Fig. 7.
Extrapolation of the number of potentially lethal heat events in the field based on improved tolerance time at temperatures ≥Tcrit. As heat acclimation increased tolerance time at temperatures ≥Tcrit, we altered the duration of a given heat event with a certain temperature that corresponded to Tcrit cutoffs: ≥29°C, ≥29°C to ≤36.5°C, and >36.5°C. (A) Projections for the average number of heat events predicted per day (ranging from 0 to 1) based on the animal's ability to tolerate more time at a given Tcrit. (B) Projections for the average number of days between heat events based on the animal's ability to tolerate more time above Tcrit, based on a given Tcrit. Overall (i.e. Tcrit ≥29°C), the average number of potentially lethal heat events per day decreases as the animals improve their tolerance time at temperatures ≥Tcrit.

