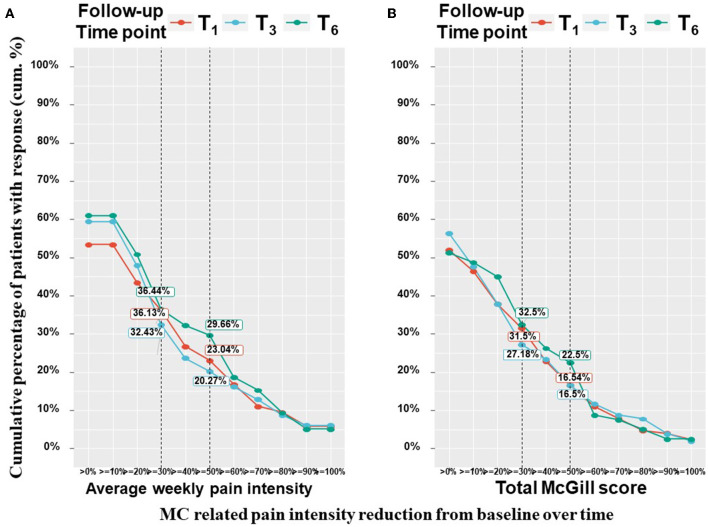
Figure 3.
Pain measures cumulative treatment response rates per time point. T1, 1-month Follow-Up; T3, 3-month Follow-Up; T6, 6-month Follow-Up; MC, medical cannabis; The percentages on the Y-axis indicates the cumulative percentage of patients with a response; Every point on the X-axis represent the percentage of MC related pain intensity reduction from baseline, no change values or an increase of pain intensities are not represented in this figure; These figure displays percentages from the entire cohort (n = 212 at T1, n = 158 at T3, n = 126 at T6) but only positive (pain decrease) reports are visible.

