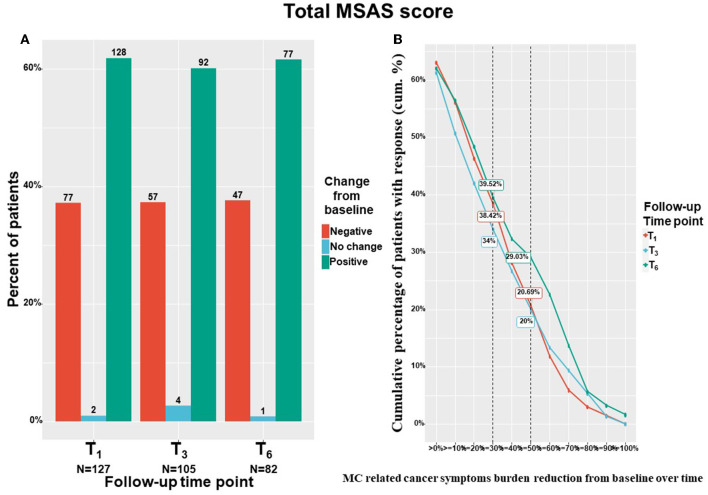
Figure 4.
Total cancer symptom burden change from baseline. T1, 1-month Follow-Up; T3, 3-month Follow-Up; T6, 6-month Follow-Up: MSAS, Memorial Symptom Assessment Scale; (A) Negative indicate patients that reported on higher pain intensity at a follow-up compared to baseline; Positive indicate patients that reported on lower pain intensity at a follow-up compared to baseline; No change indicate patients that reported on the same pain intensity at a follow-up compared to baseline; MC, medical cannabis; The percentages on the Y-axis indicates the cumulative percentage of patients with response; For (B), every point on the X-axis represent the percentage of MC related pain intensity reduction from baseline, no change values or an increase of pain intensities are not represented in this figure; Numbers of patients are based on patients that reported fully on the measures at baseline and at the corresponding follow-up time point; (B) displays percentages from the entire cohort (n = 212 at T1, n = 158 at T3, n = 126 at T6) but only positive (MSAS score improvement) reports are visible.

