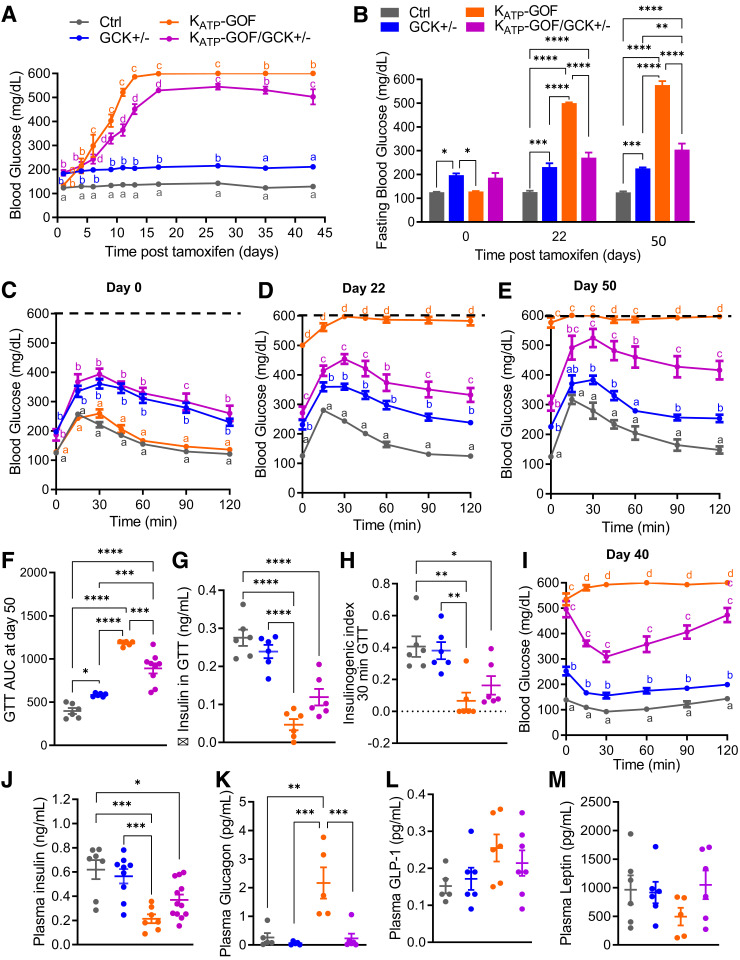
Figure 1.
Blood glucose is reduced in KATP-GOF diabetic mice with reduced β-cell glucokinase. A: Nonfasted blood glucose over time in KATP-GOF mice after tamoxifen induction of transgene expression (n = 9–18 mice/group). B: Fasting blood glucose levels at day 0, 22, and 50 after tamoxifen induction (n = 6–9 mice/group). C–F: GTT performed at day 0 and at days 22 (n = 4–9 mice/group) and 50 after tamoxifen induction (dashed lines indicate the limit of the detection of the glucose meter) and area under the curve (AUC) (n = 6–9 mice/group). G and H: Change (Δ) in insulin secretion at 30 min after glucose challenge over fasting (0 min) and II during GTT at day 50 after tamoxifen induction (n = 6 mice/group). I: ITT performed in mice 40 days after tamoxifen induction. J–M: Plasma insulin (n = 8–12 mice/group), glucagon (n = 5 mice/group), GLP-1, and leptin (n = 5–7 mice/group) at day 40 after tamoxifen induction. Data are mean ± SEM. *P < 0.05, **P < 0.01, ***P < 0.001, ****P < 0.0001. Nonsignificant differences are not shown. For panels A, C, D, E, and H, lowercase letters are used to indicate significant differences of P < 0.05 between groups. The same letters indicate no significant difference. Ctrl, control.

