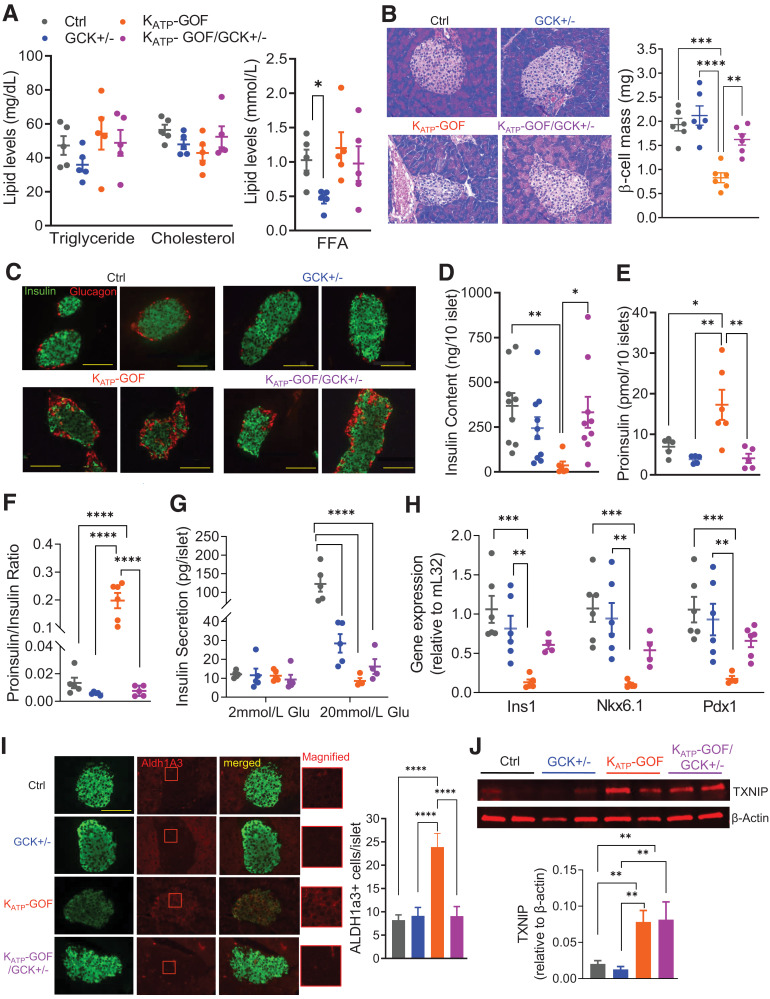
Figure 2.
Plasma hormones and lipid levels and cellular stress markers. A: Plasma triglyceride, cholesterol (left), and FFAs (right) at day 45 after tamoxifen induction (n = 5 mice/group). B and C: Representative images for H-E staining (left) and β-cell mass (right), and insulin (green) and glucagon (red) staining in pancreata at day 45 (scale bars 100 µm, n = 5 mice/group). D: Total insulin content in islets at day 45 (n = 6–10 mice/group). E and F: Total proinsulin content and proinsulin-to-insulin ratio in islets at day 45 (n = 5–6 mice/group). G: GSIS at basal (2 mmol/L) and high (20 mmol/L) glucose in islets at day 45 (n = 5 mice/group). H: Quantitative real-time PCR analysis of Ins1, NKX6.1, and Pdx1 for islets (n = 4–6 mice/group). I: Representative images for insulin (green), ALDH1A3 (red) (magnified on right), and merged staining on pancreatic sections from all genotype mice, with quantification of ALDH1A31 cells per islet (scale bar 100 µm, magnified box is 30x30 µm; n = 5 mice/group at day 45). J: Representative Western blot and quantitative analysis for islets for TXNIP at day 40 (n = 6–8 mice/group). Data are mean ± SEM. *P < 0.05, **P < 0.01, ***P < 0.001, ****P < 0.0001. Nonsignificant differences are not shown. Ctrl, control.

