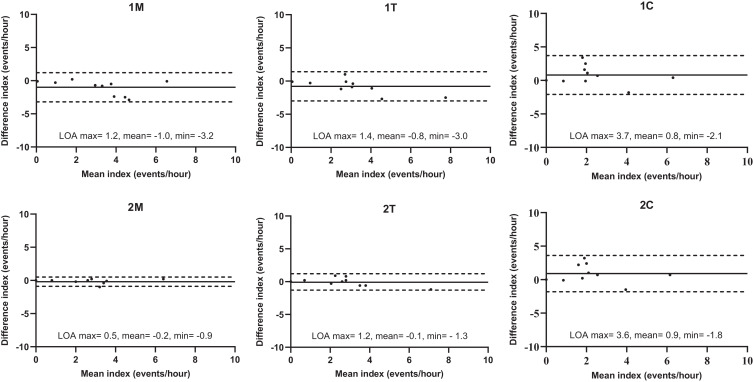
Figure 1. Bland-Altman plots of rhythmic masticatory muscle activity indices for tested scoring montages.
Comparisons of tested scoring montages were made against PSG with bilateral masseter and temporalis muscle EMG traces. Solid line = the mean difference, dashed line = 95% LOA (maximum: the upper 95% LOA; minimum: the lower 95% LOA). EMG = electromyography, LOA = limits of agreement, PSG = polysomnography, 1M = PSG with unilateral masseter muscle EMG trace, 2M = PSG with bilateral masseter muscle EMG traces, 1T = PSG with unilateral temporalis muscle EMG trace, 2T = PSG with bilateral temporalis muscle EMG traces, 1C = PSG with unilateral chin EMG trace, 2C = PSG with bilateral chin EMG traces.

