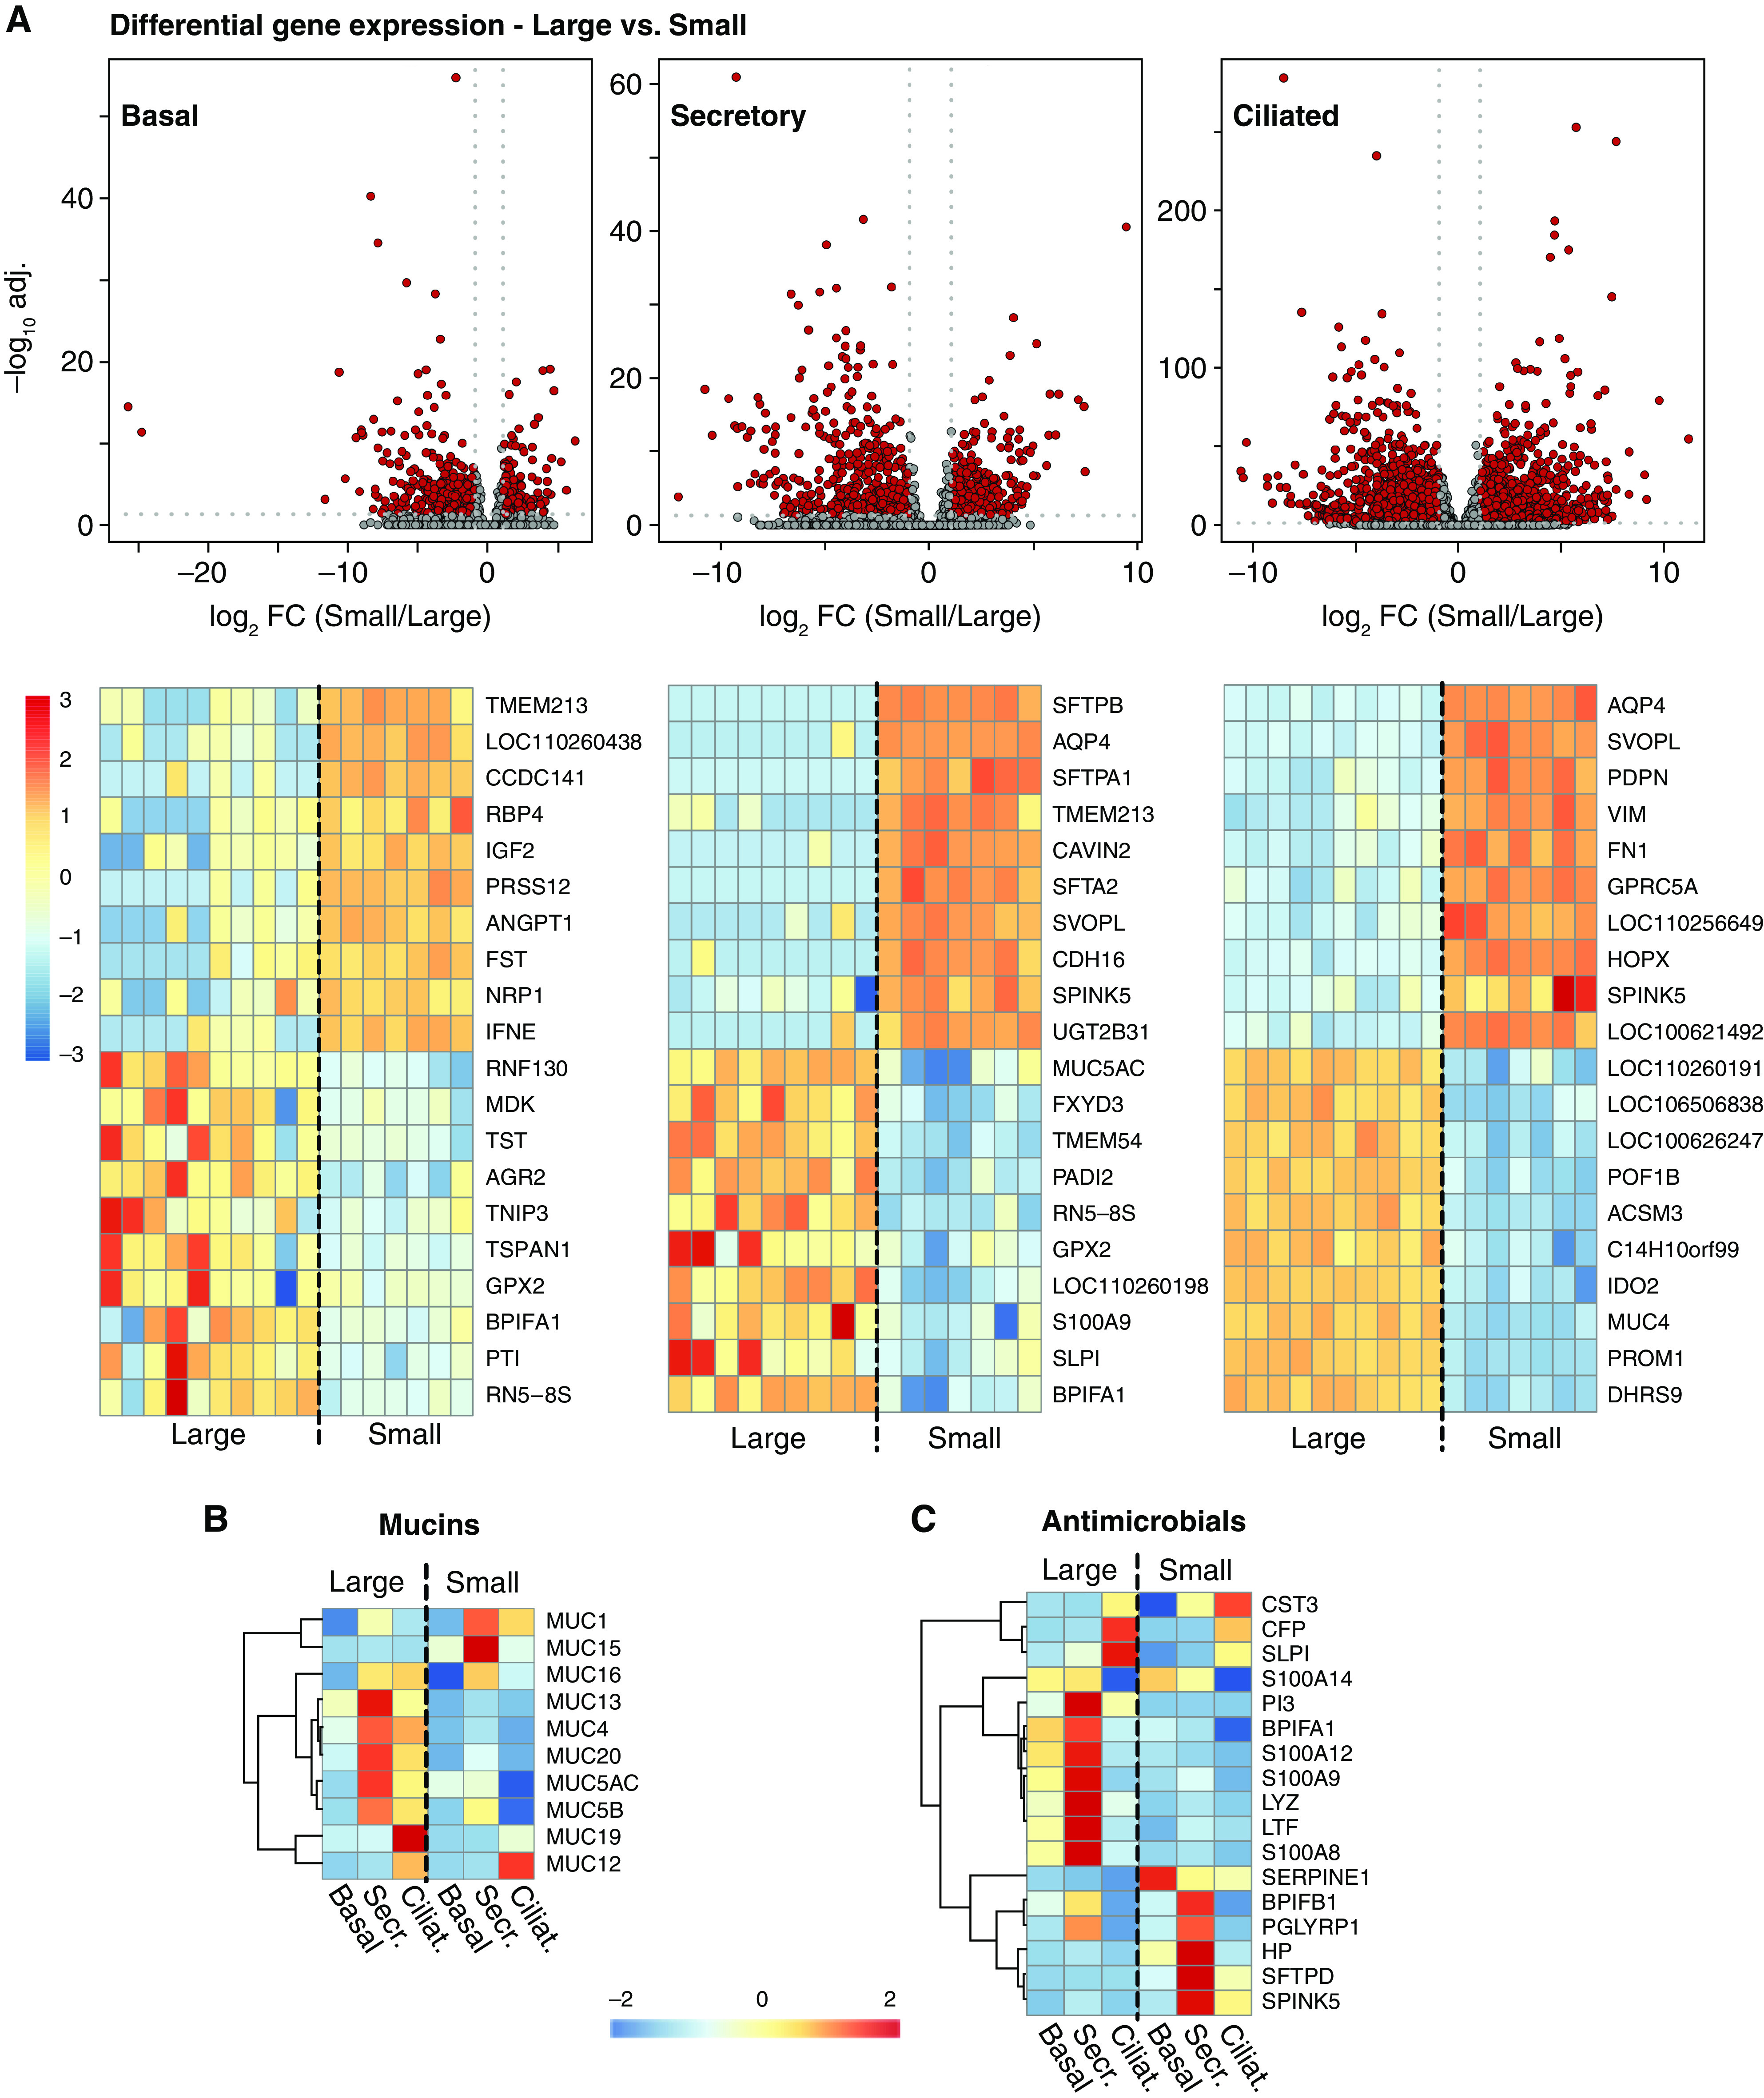
Figure 3.

Cell type–specific gene expression varies between large and small airways. (A) Volcano plots and top 20 cell-specific differentially expressed genes in basal, secretory, and ciliated large and small airway epithelial cells. (B) Mucin and (C) antimicrobial genes heatmaps: normalized and centered average gene expression in large and small airway for cell types indicated, genes detected at 2 or higher CPM. n = 10 large and 7 small airway. CFTR+/+ and CFTR −/− pig samples were grouped together. adj. = adjusted; FC = fold change.
