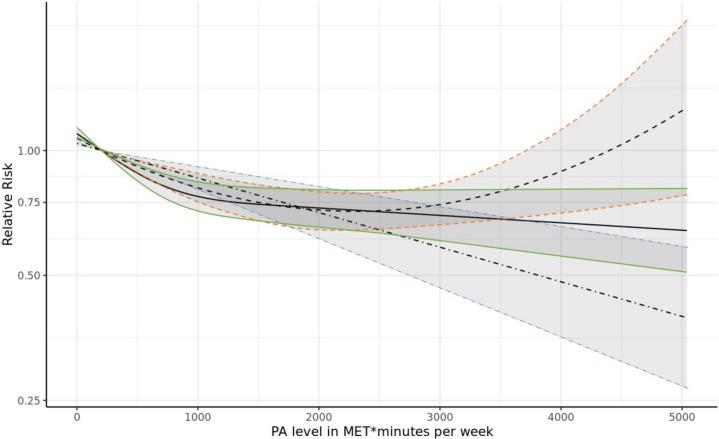
Figure 3.
Dose–response analysis of physical activity (PA) levels and all-cause dementia incidence. Linear trend shown with dashed-dotted line and 95% CI in blue; quadratic trend shown with dashed line and 95% CI in orange; and cubic spline trend shown with solid line and 95% CI in green. MET, metabolic equivalent of energy expenditure.

