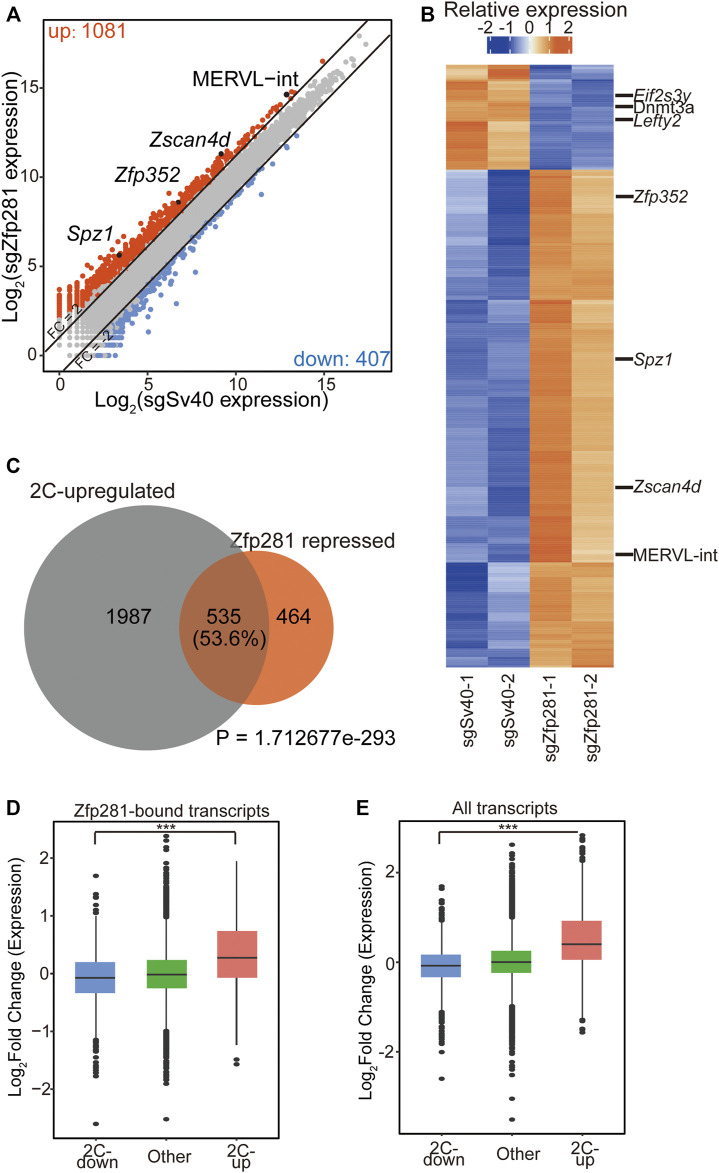
FIGURE 2.
Zfp281 impedes the expression of 2C-upregulated transcripts during the 2C-like transition. (A) A scatter plot comparing the gene/repeat expression profiles between control and Zfp281-perturbed mESCs after Dux induction. The criteria for gene changes are Fold change (FC) > 2 and False discovery rate (FDR) < 0.05. (B) A heatmap showing the relative expression levels of differential expression genes/repeats (FC > 1, FDR < 0.05) from two biologically independent samples of control and Zfp281-perturbed mESCs after Dux induction. (C) A Venn diagram demonstrating overlaps of Zfp281-repressed transcripts and 2C-upregulated transcripts. Zfp281-repressed transcripts are defined as the transcripts activated in Zfp281-perturbed mESCs compared to control mESCs after Dux induction (FC > 2 and FDR < 0.05). p Value was calculated by a hypergeometric test. (D) A box plot showing the log2 (FC) of Zfp281-bound transcripts after Dux induction. Within all Zfp281-bound transcripts, 2C-upregulated transcripts exhibit the most significant changes. (E) A box plot showing the expression levels of 2C-regulated and other transcripts after Dux induction. (A,B) FDRs were estimated using the Benjamini–Hochberg method on the p Values of the two-sided quasi-likelihood F-test calculated using the edgeR package. (D,E) The black central line is the median value, the box limits indicate the upper and lower quartiles. (A–E) The X in sgX refers to the gene that sgRNA targets to; sgSv40 is negative control. (D–E) p Values were calculated with the absolute value of the log2 (FC) by the Wilcoxon rank-sum, *** <0.001. The dots represent outliers.

