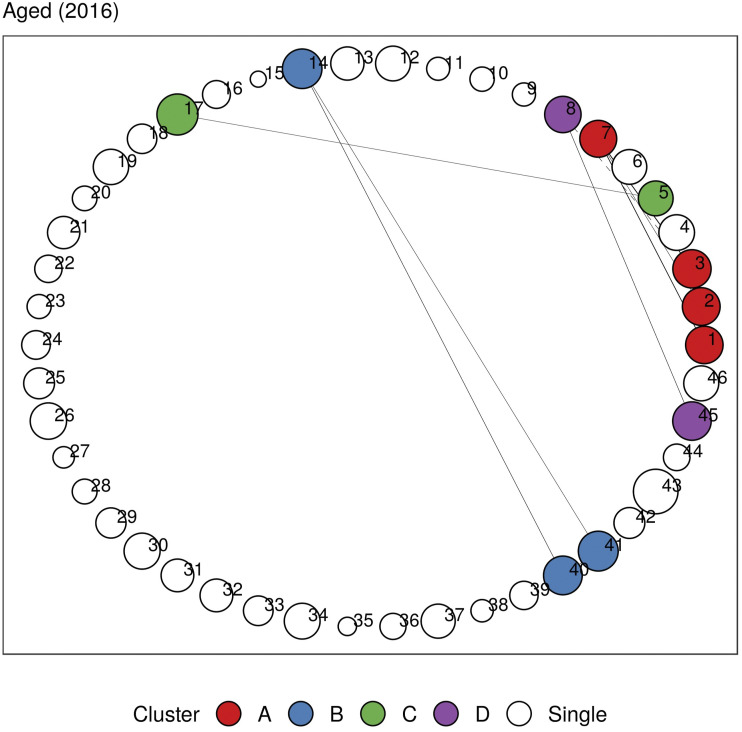
Figure 5.
Undirected multimorbidity network in the Aged subgroup in 2016. Edge thickness is proportional to the lift between each disease pair. Intra-group edges and inter-group edges are represented by solid lines and dashed lines, respectively. Only communities with more than one node are colored. See Figures 1 and 2 for mapping of disorder to index and MedDRA SOC abbreviations. See Supplementary Material C for other age groups and years.

