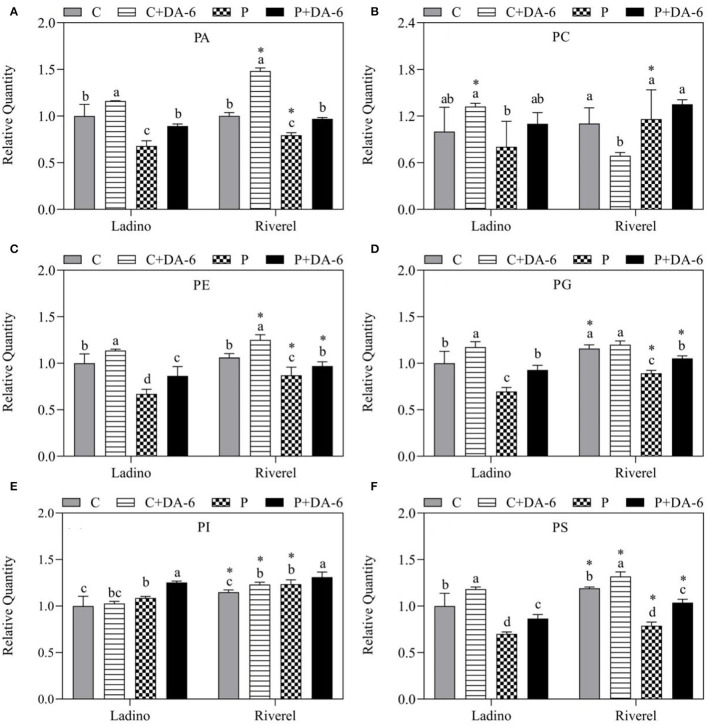
Figure 6.
Effect of water-deficit stress and DA-6 pretreatment on relative content of (A) PA, (B) PC, (C) PE, (D) PG, (E) PI, and (F) PS in the two white clover cultivars (Ladino and Riverdel) after 9 days of water-deficit stress. Data are mean ± standard error (n = 4). Vertical bars demonstrate the LSD values (p ≤ 0.05). Different letters above the columns indicate significant differences between different treatments at a particular time duration under normal conditions or water stress. * represents the significant difference for a specific treatment (C, C+DA-6, P, or P+DA-6) between Ladino and Riverdel. C, control treatment; C+DA-6, control + DA-6 pretreatment; P, water-deficit stress; P+DA-6, water-deficit stress + DA-6 pretreatment; PA, phosphatidic acid; PC, phosphatidylcholine; PE, phosphatidylethanolamine; PG, phosphatidylglycerol; PI, phosphatidylinositol; PS, phosphatidylserine.

