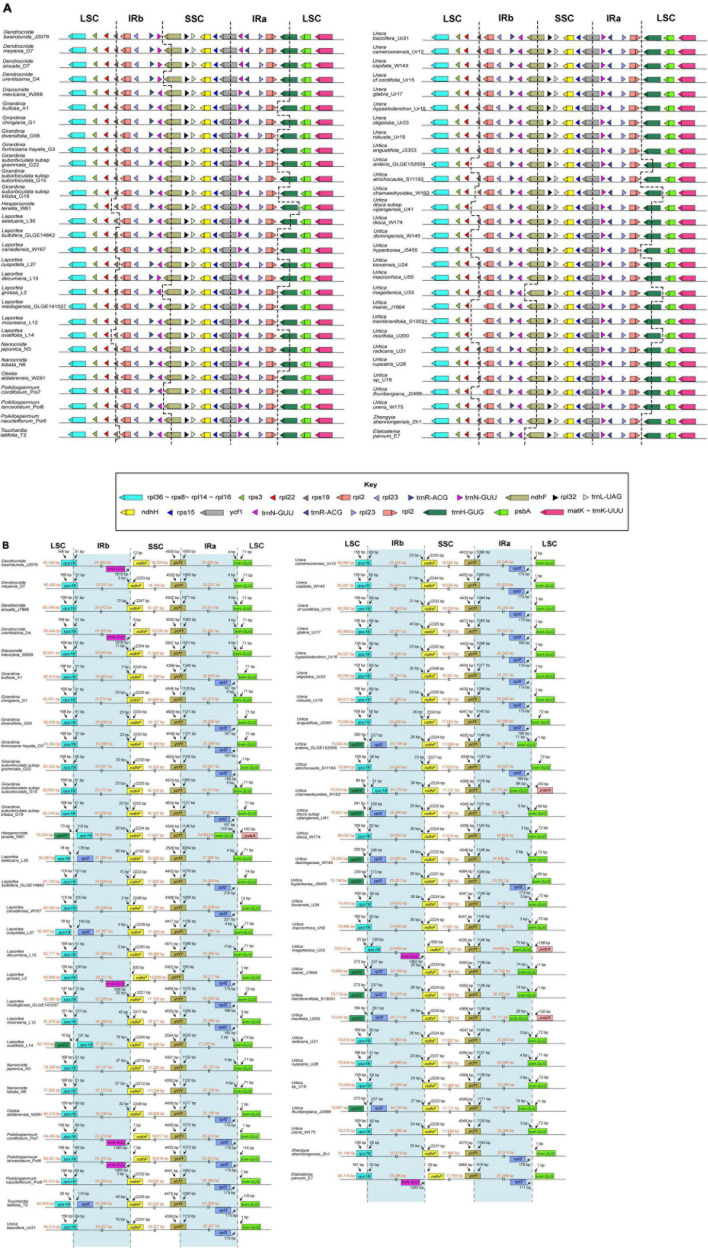
FIGURE 3.
(A) representative map showing expansions and contractions in the IR region; (B) comparison of the IR/SC junctions among 57 Urticeae plastomes. The genes around the borders are shown above or below the main line. LSC, Large Single Copy; SSC, Small Single Copy; IR (a and b), Inverted Repeat a and b.

