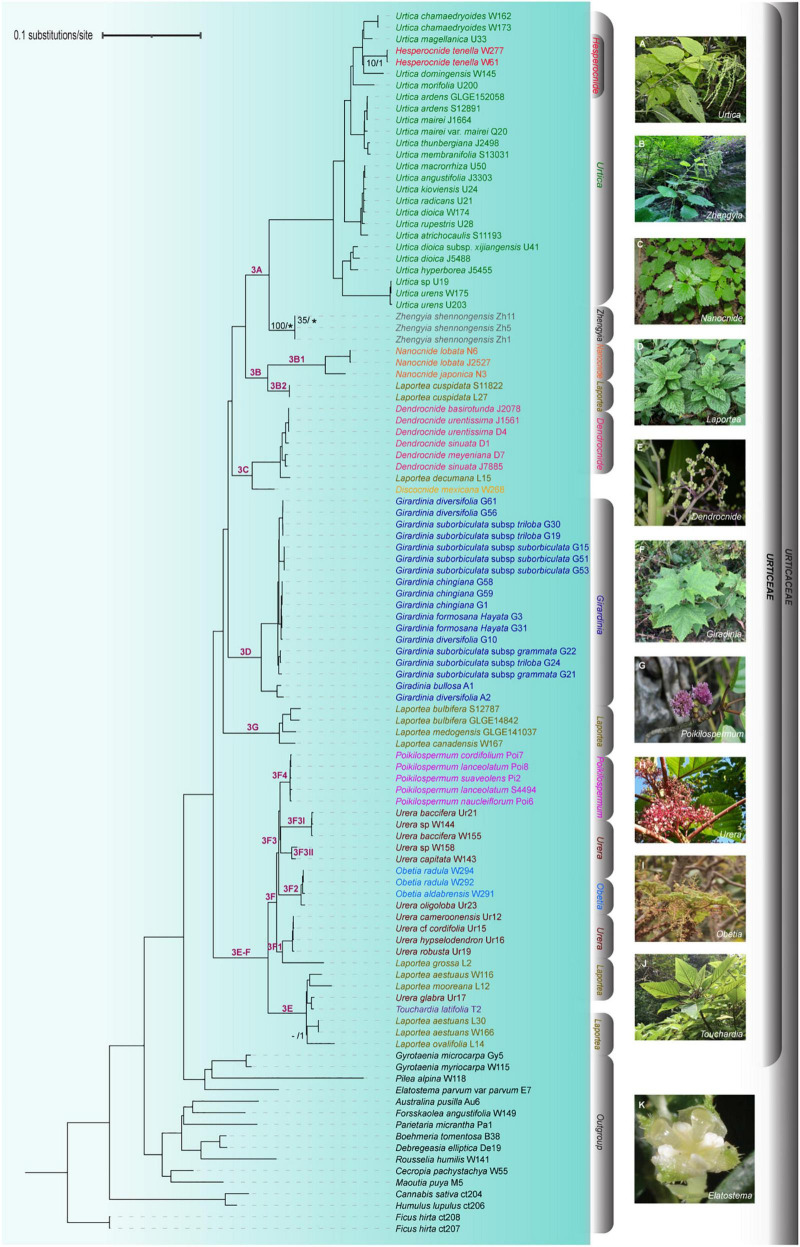
FIGURE 5.
Phylogenetic relationships of Urticeae inferred from maximum likelihood (ML) and Bayesian inference (BI) based on combined complete plastome and nrDNA sequences. Numbers on the branch indicate clade classification (in purple) and ML_BS/BI_PP values (in black)—note that branches with no support values indicate both ML_BS ≥ 90 and BI_PP = 1.00; lastly, “*” indicate incongruence between ML and BI trees and “–” no support values. Representative images of genera within Urticeae s.l. are shown on the right. Photographs: (A–C,E,G,K) by Z.Y. Wu, (D,F) by C.A. Ogoma, (H) by U. Dreschel, (I) by C. Kunath, and (J) photographed by J. Cantley.

