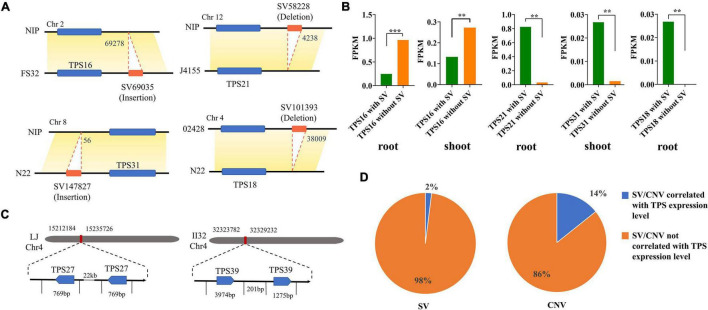
FIGURE 3.
SVs and CNVs overlapping with the TPS gene family. (A) The display of SV insertion or deletion 2 kb upstream or downstream of TPS genes. (B) SV insertion or deletion significantly altered some of the TPSs expression in roots or shoots (**p < 0.01 and ***p < 0.001, student’s t-test). (C) Schematic diagram of the occurrence of CNVs that significantly altered TPS expression. (D) Pie chart showing the proportion of SVs or CNVs that significantly altered TPS expression levels take up total SVs or CNVs that overlapped with the TPS gene family.

