
Figure 5.
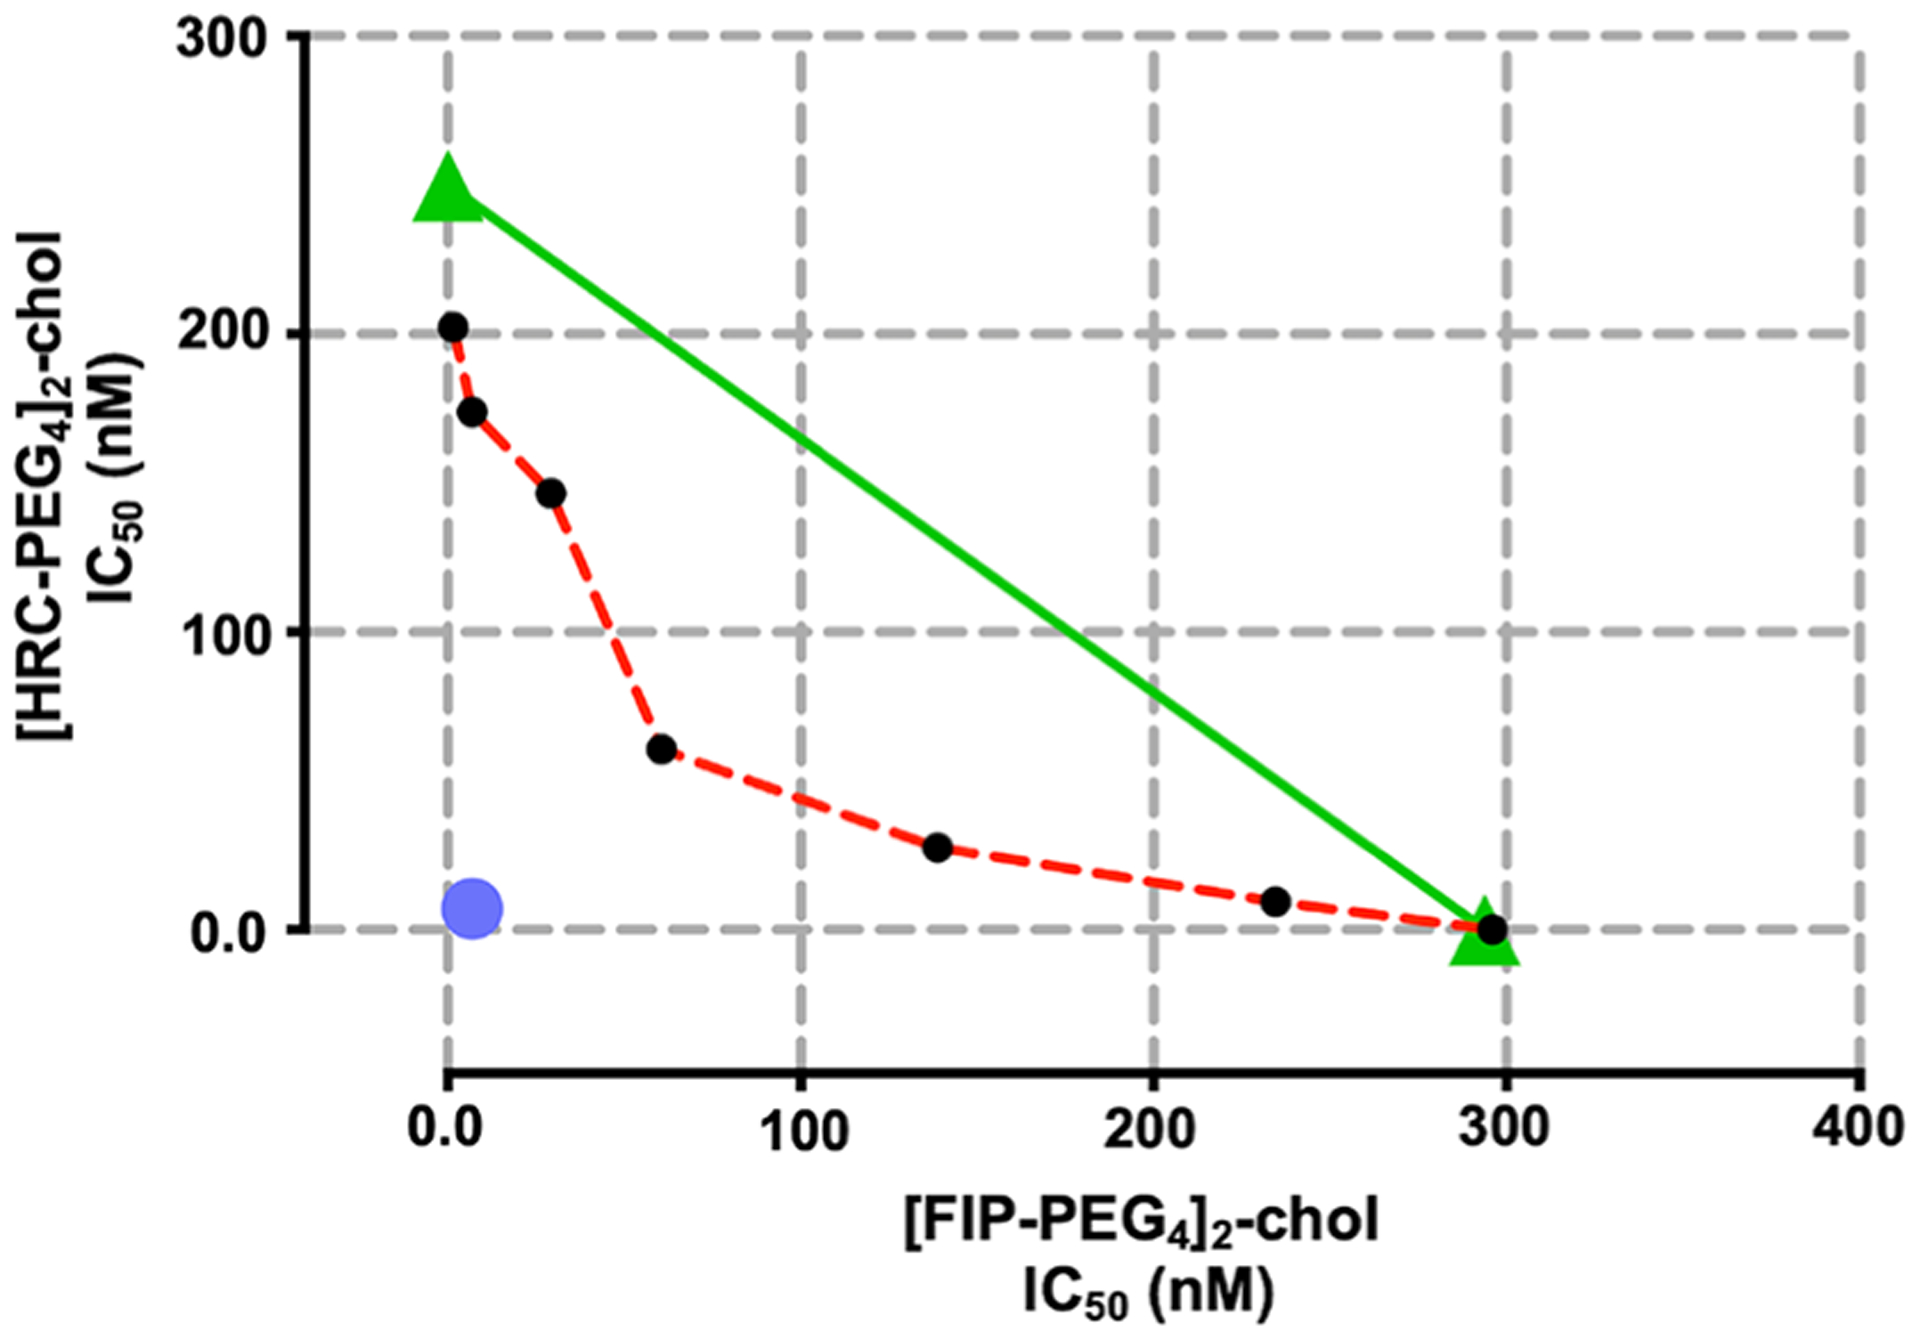
[FIP–PEG4]2–chol and [HRC–PEG4]2–chol synergize to inhibit fusion. Isobologram analysis of FIP + HRC peptide, where the green diagonal line represents the line of additivity, and the experimental data points, represented by dots below, on, or above the line, indicate synergy, additivity, or antagonism, respectively. The red dotted line is the curve generated from contributions of FIP and HRC in different ratios. The blue dot represents the IC50 of [FIP–HRC–PEG4]2–chol. The data are from three experiments.