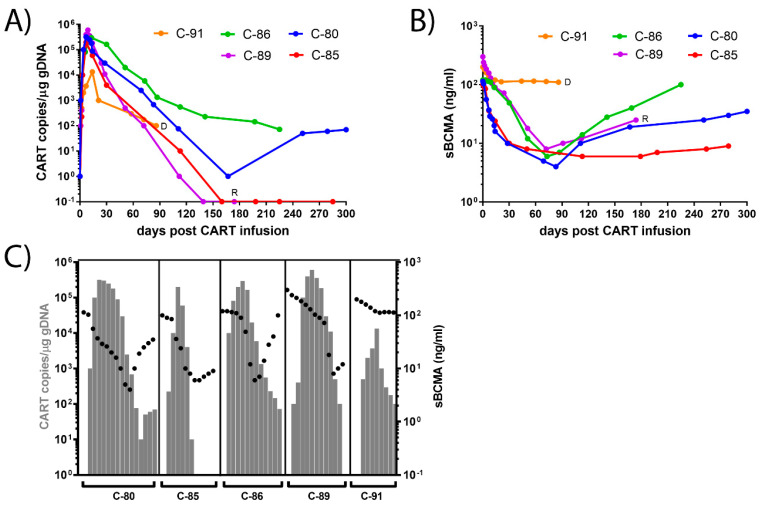
Figure 1.
Dynamics of CAR-T and sBCMA plasma levels in the peripheral blood of patients. (A) Dynamics of CAR-T copies/μg genomic DNA in the peripheral blood. Rapid rise to high peak levels (>1.9E + 05 copies/μg), followed by decline to undetectable levels (C-85, C-89) or persistence at low levels (C-80, C-86). Rapid rise to mediocre peak levels (1.3E + 04 copies/μg) and decline to low levels (C-91). The concentration of the CAR-T copies/μg gDNA is given on a logarithmic scale on the y-axis. (B) Dynamics of sBCMA concentrations in the plasma. Rapid decline to minimal levels (C-80, C-85, C-86, C-89), followed by rebound to normal levels (C-80, C-86). Persistence of elevated levels (C-91). Response determination at the end of the study entailed three sCR (C-80, C-85, C-86), one relapsed (C-89, R), one deceased (C-91, D). The concentration of the sBCMA is given on a logarithmic scale on the y-axis. (C) Dynamics of CART copies/μg gDNA (grey bars) and sBCMA (ng/mL) in the plasma (black dots).

