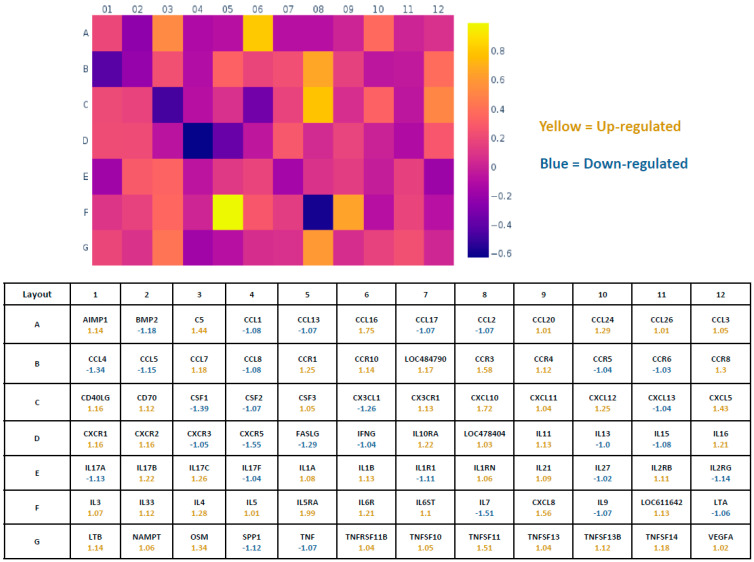
Figure 4.
Heat map showing the fold change in gene expression in CKD dogs (n = 10) when compared to controls (n = 10). The individual squares in a heat map are scaled with a range of colors proportional to gene expression values. The figure below (Rows A to G) corresponds to the squares above, and each square indicates the average values for that gene, with numerically positive values indicating up-regulation and negative values indicating down-regulation. Row H (not shown) included the housekeeping genes ACTB, B2M, GAPDH, HPRT1, and RPLP in the assay. Other controls in row H included those for detection of genomic DNA contamination, reverse transcription control, and positive PCR control. As mentioned in Figure 3, data are presented as mean fold change (ΔΔCt) normalized to the housekeeping gene, HPRT1.

