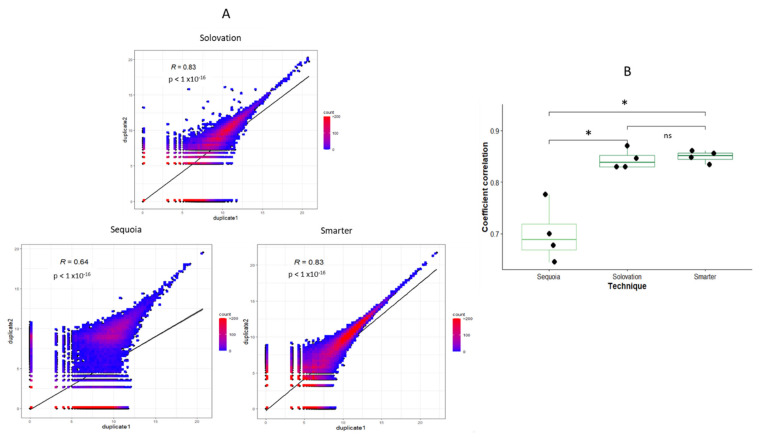
Figure 4.
Reproducibility among Sequoia, Solovation, and Smarter sequencing kits. (A) Correlation with Spearman test of gene expression between replicates of the same kit. (B) Correlation between 4 replicates for Sequoia, Solovation, and Smarter. Coefficient correlations of each technique were compared using a Mann–Whitney test. The lower and upper hinges correspond to the first and third quartiles. The upper whisker extends from the hinge to the largest value no further than 1.5 * interquartile range from the hinge. The lower whisker extends from the hinge to the smallest value at most 1.5 * interquartile range of the hinge.

