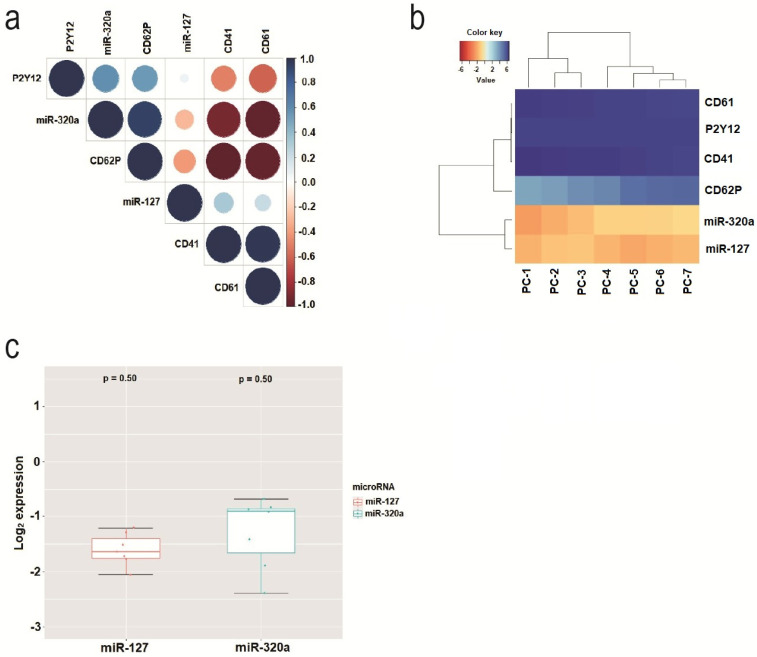
Figure 3.
(a) Correlogram showing the miRNAs and membrane receptors that most correlated during the 7 days of PC storage. The scales with a blue gradient are positively correlated, while those with a red gradient are negatively correlated; the white gradient represents insignificant correlation (p > 0.01). (b) Heatmap showing the patterns of expression of miRNAs and receptors during the 7 days of storage of PCs. Z-score was the metric applied to infer the best clustering patterns. Gradients with a tendency towards a red color indicate a lower Z-score, and gradients with a tendency towards a blue color indicate a greater Z-score. (c) Variation in the levels of expression of miR-127 and miR-320a during the 7 days of storage.

