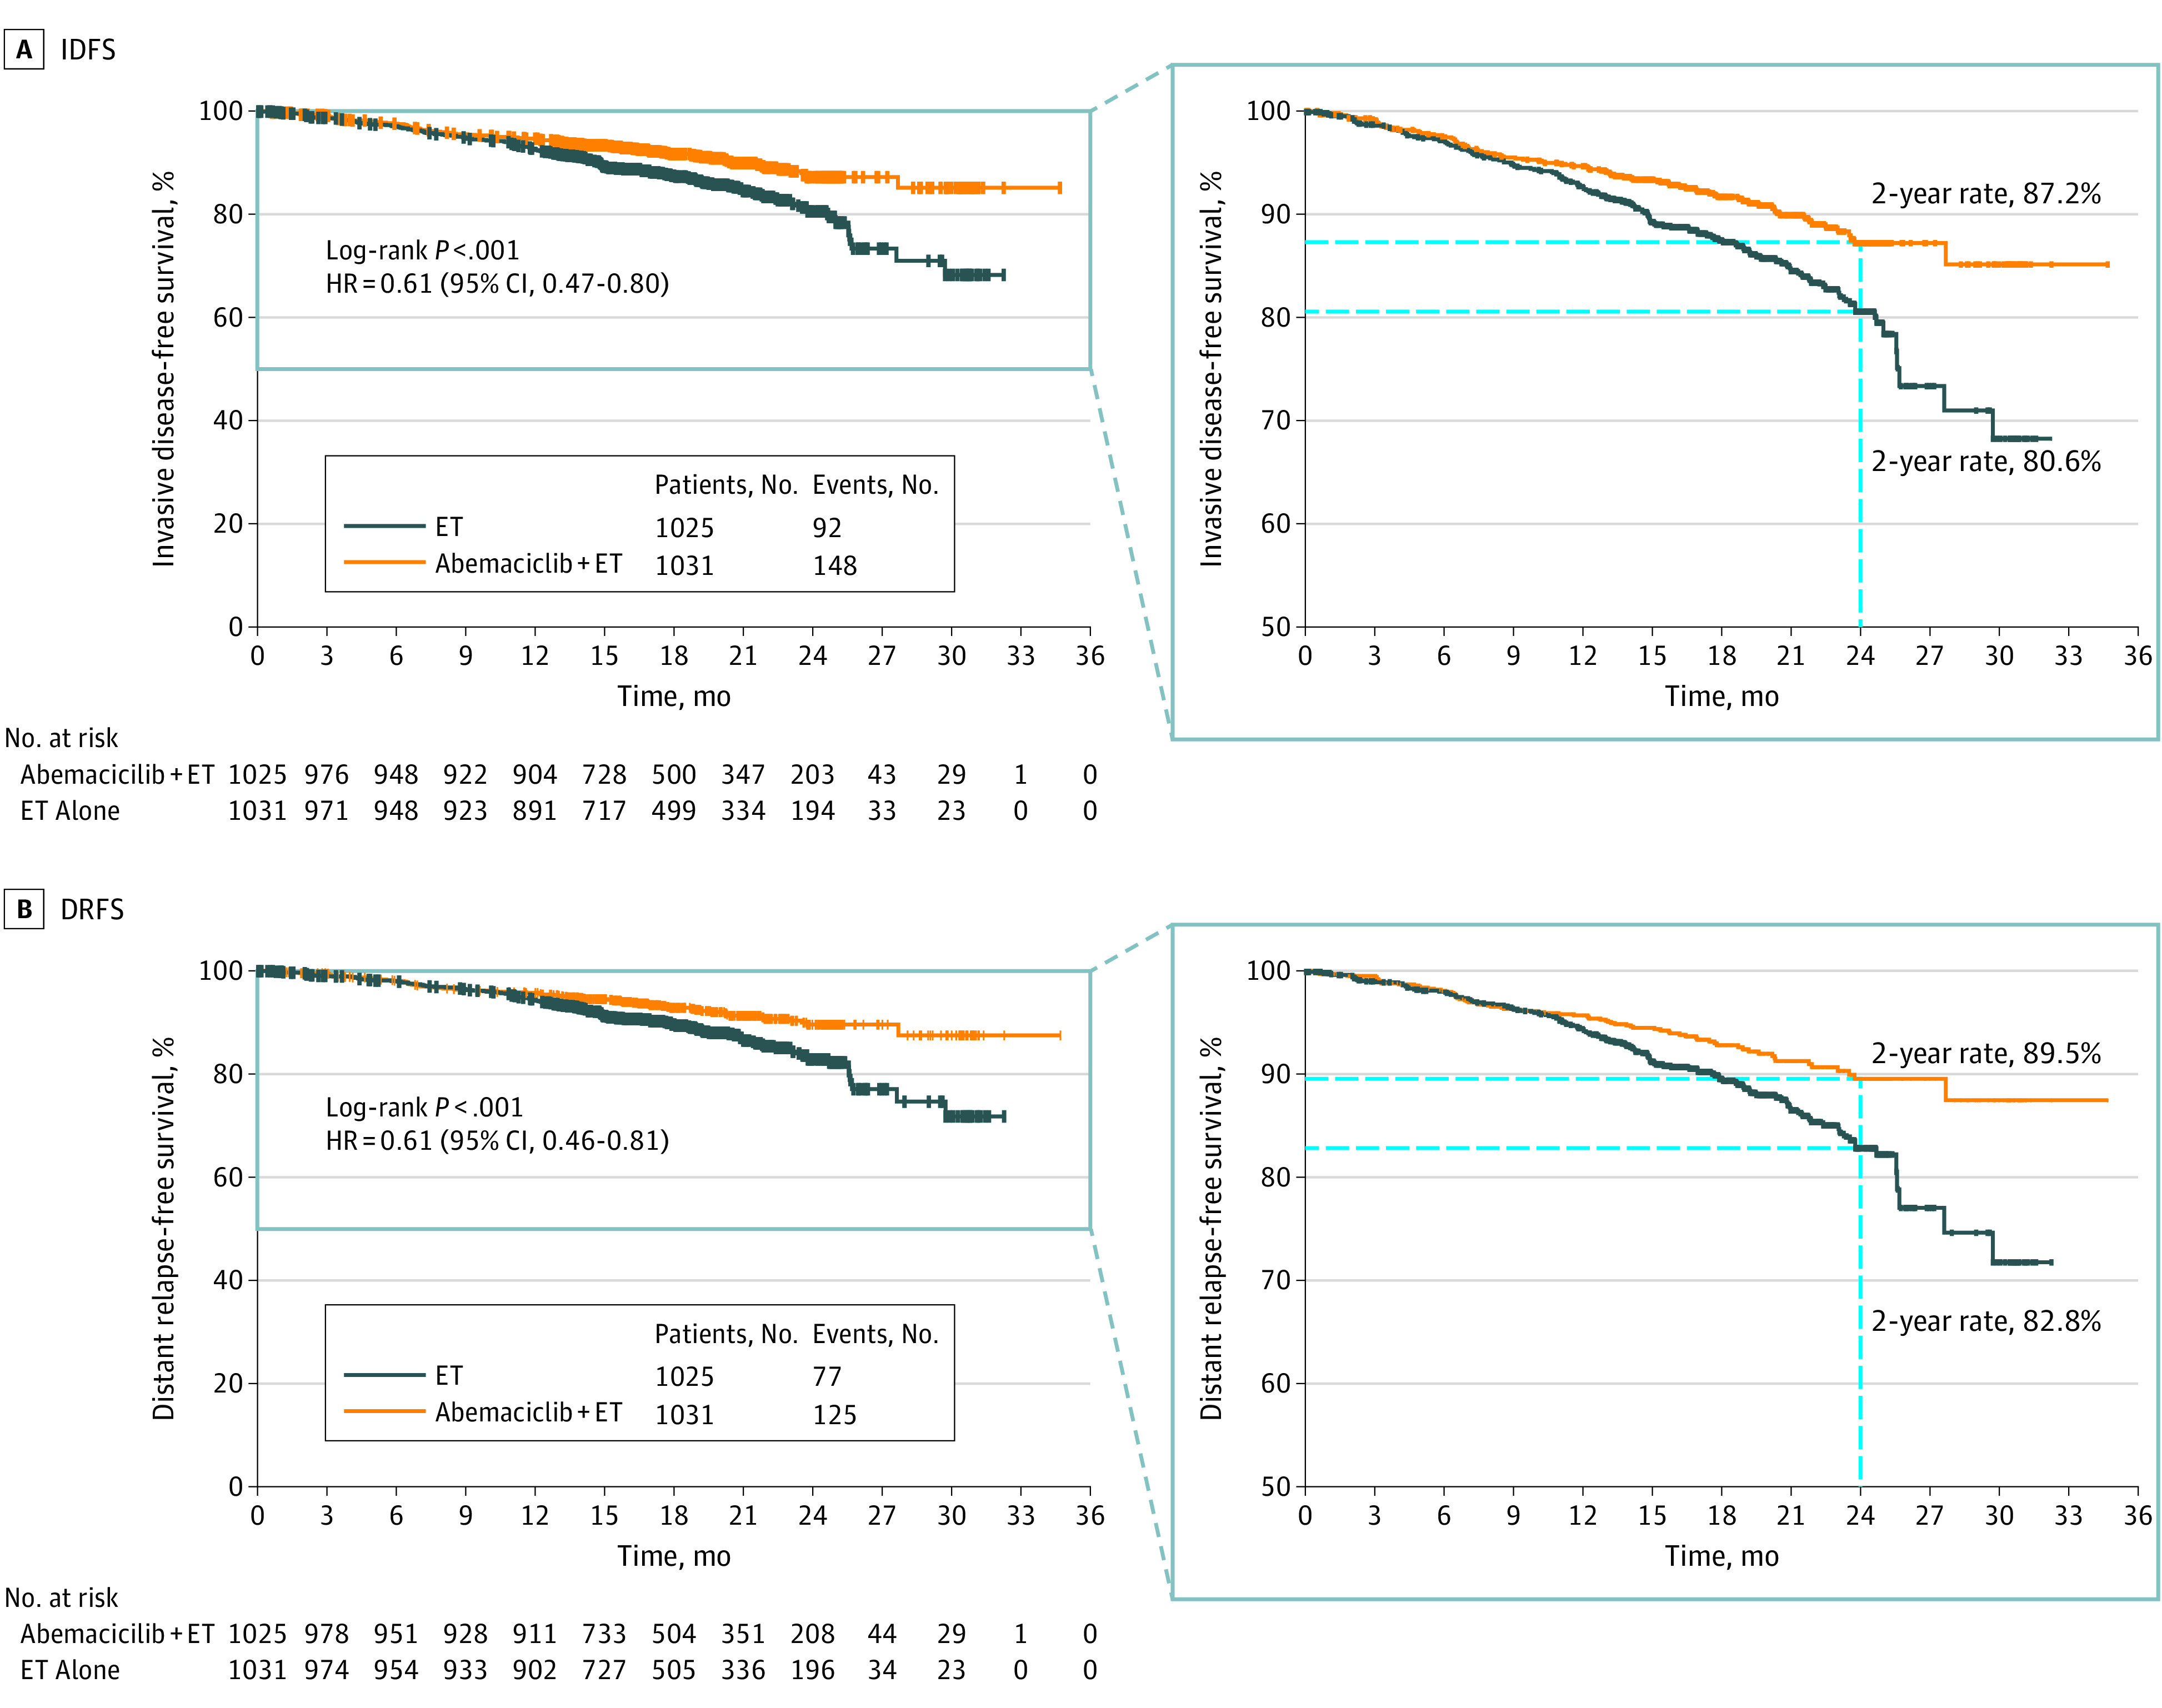
Figure. Kaplan-Meier Curves of Invasive Disease-Free Survival (IDFS)/Distant Relapse-Free Survival (DRFS) in Patients Who Received Neoadjuvant Chemotherapy (NAC).

Kaplan-Meier curves of IDFS (A), DRFS (B), and IDFS/DRFS (inset) to better visualize separation of the curves in patients who received NAC. The inset tables present the number of events per arm, unstratified hazard ratio (HR) in the NAC subgroup, and the 2-year rates in each arm (blue dotted lines). ET indicates endocrine therapy.
