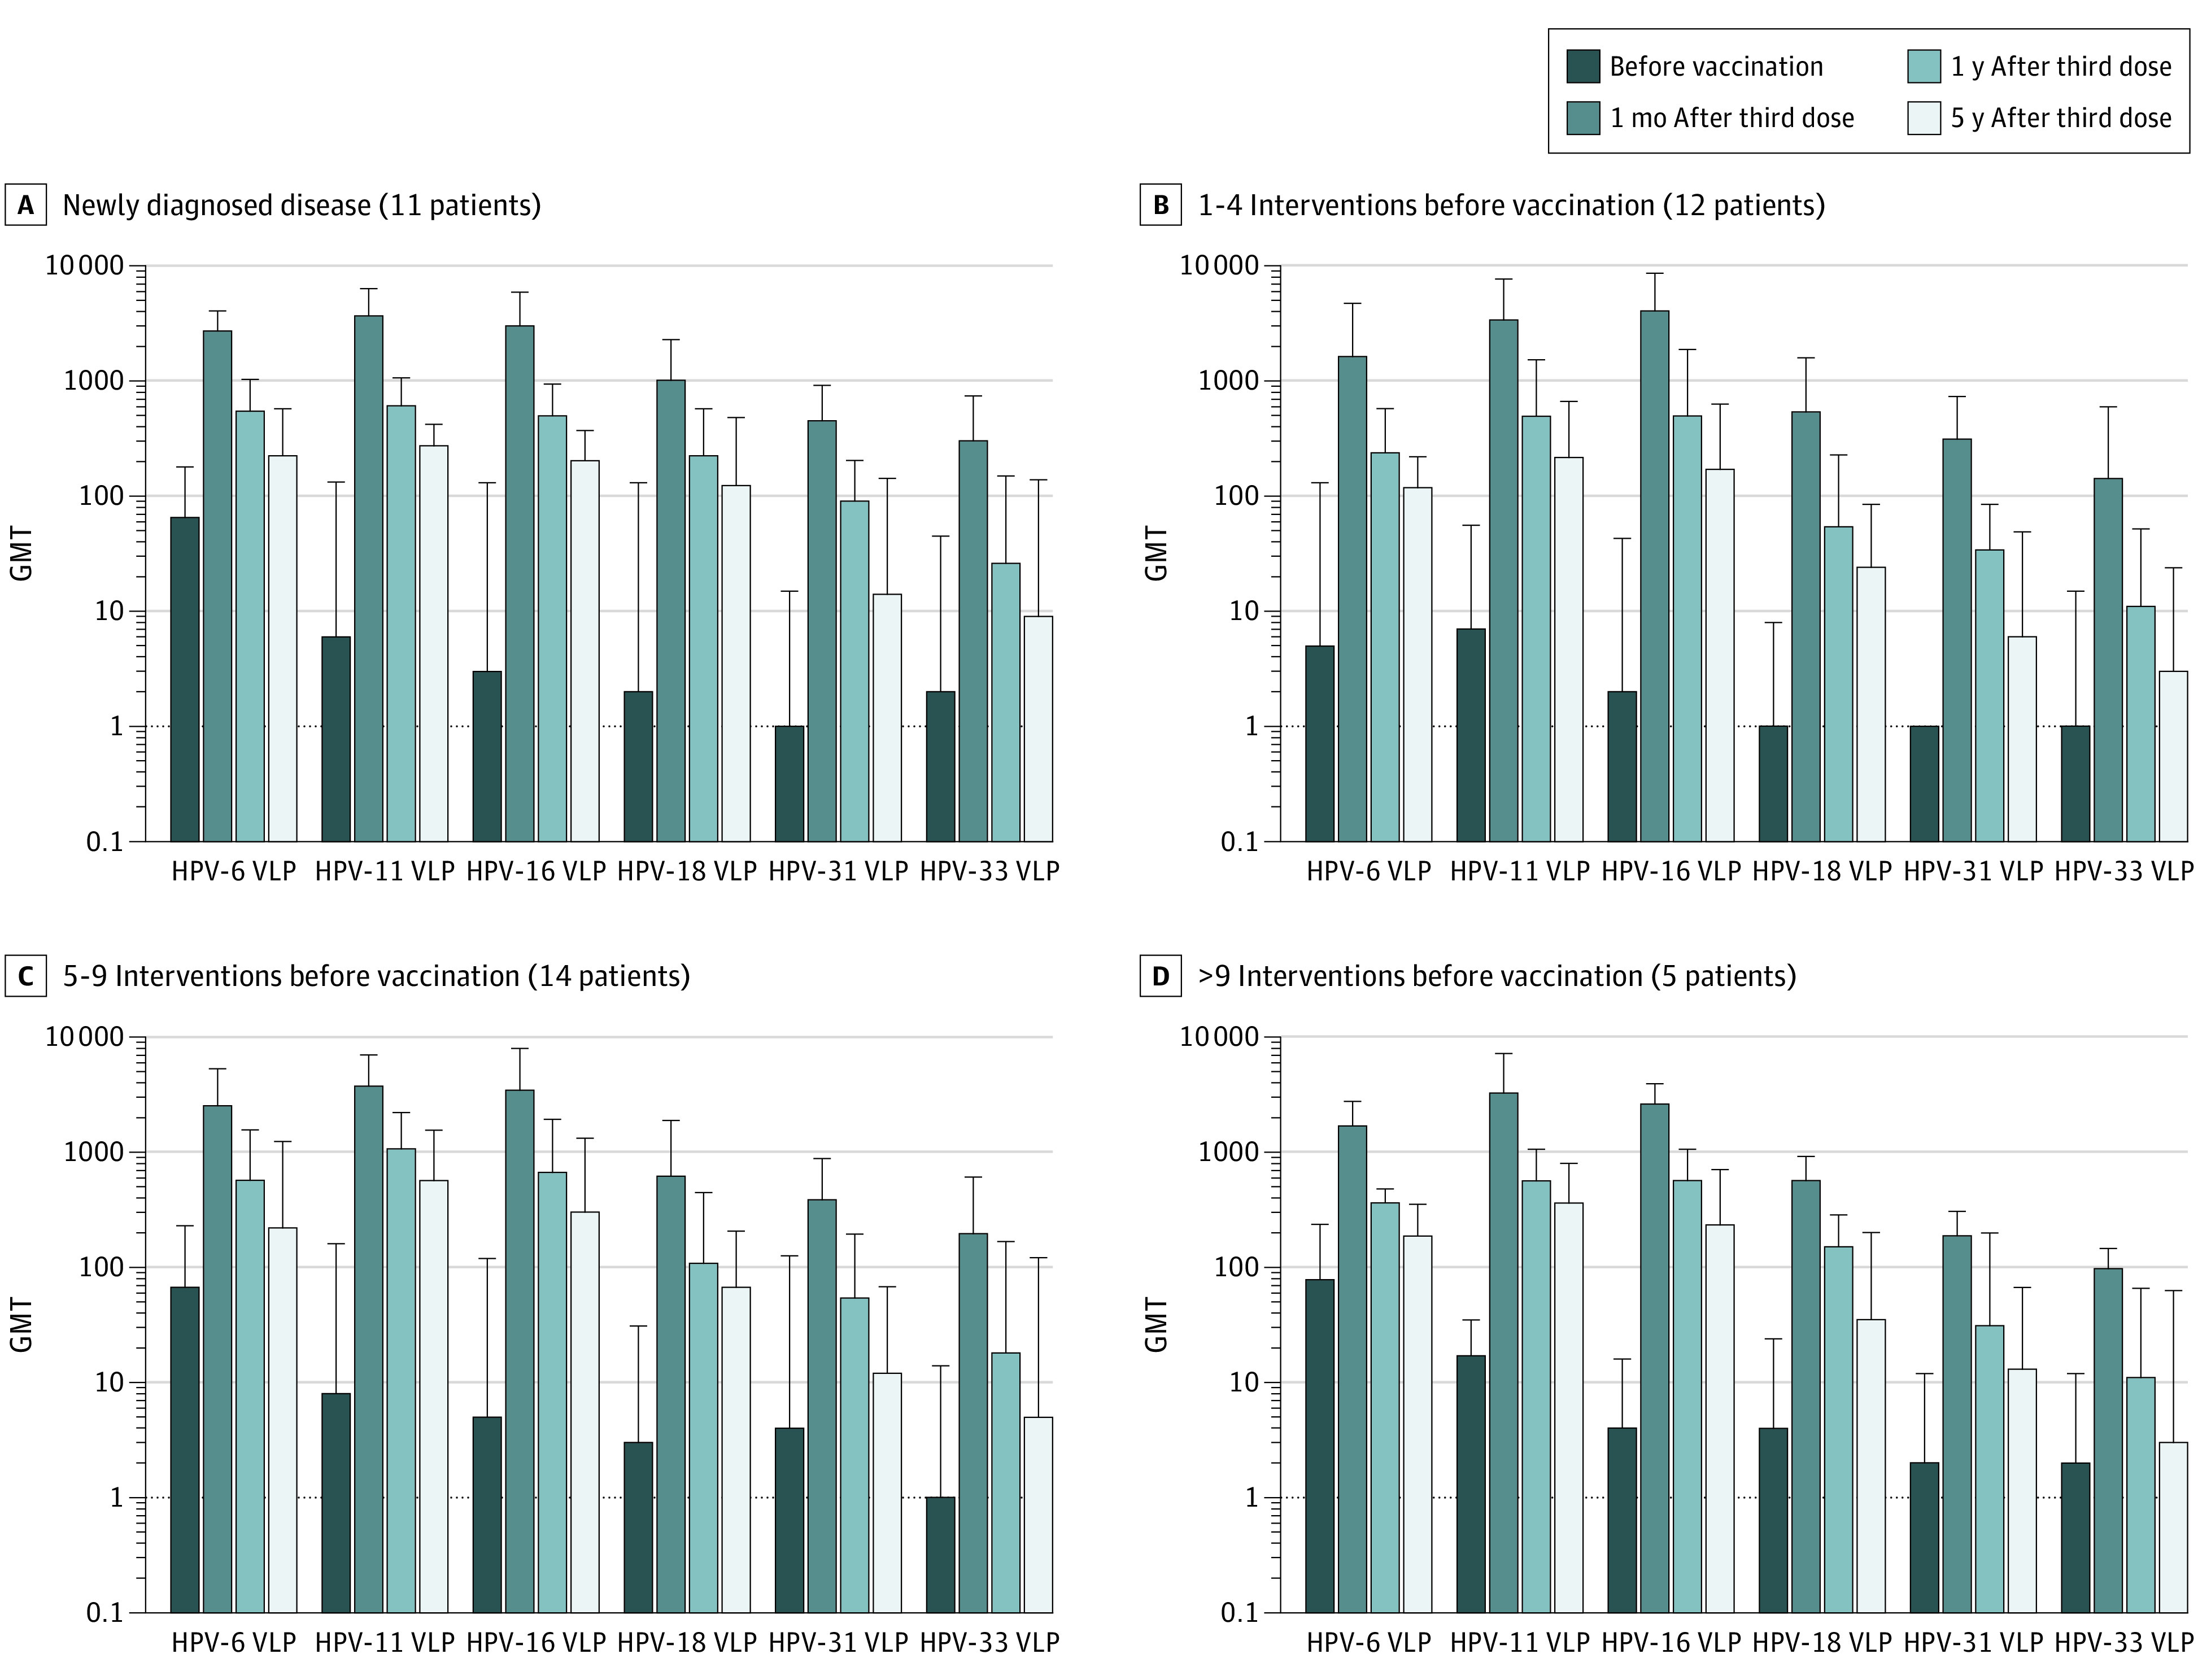
Figure 1. Geometric Mean Titer (GMT) of Human Papillomavirus (HPV)–Specific Antibodies Before Vaccination, 1 Month, 1 Year, and 5 Years After the Third Vaccine Dose.

On the y-axis, the logarithmic scale was used. Four groups of participants are shown, divided according to lifetime number of interventions prior to vaccination: (A) newly diagnosed disease (≤1 surgical intervention at enrollment), (B) 1 to 4 interventions, (C) 5 to 9 interventions, and (D) more than 9 interventions. VLP indicates virus-like particle. The error bars represent 1 SD.
