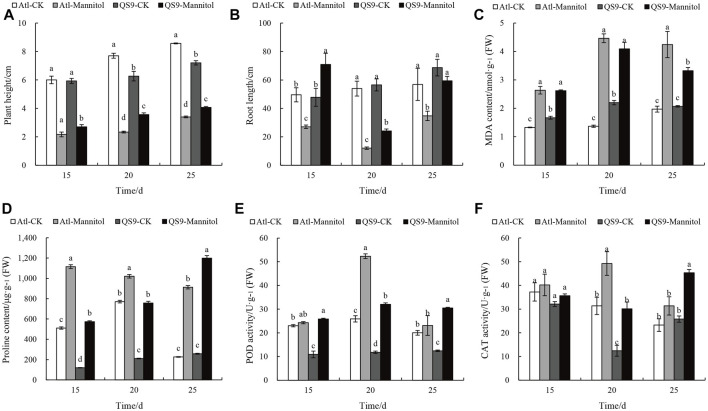
FIGURE 8.
Changes in phenotypic and physiological indexes of potato test-tube plantlets in different periods under drought treatment. (A,B) height of plants and root length in control and mannitol-induced drought treated media measured in cm. (C) MDA content (nmol/g FW) of QS9 and Atl under stressed and unstressed conditions. (D) Proline content (μg/g FW) under drought conditions. (E,F) POD and CAT activities (U/g FW) in mannitol-induced drought treatment and control. Different letters show significant differences between treatments. Duncan’s method was used for significance analysis for multiple comparisons (p < 0.05)

