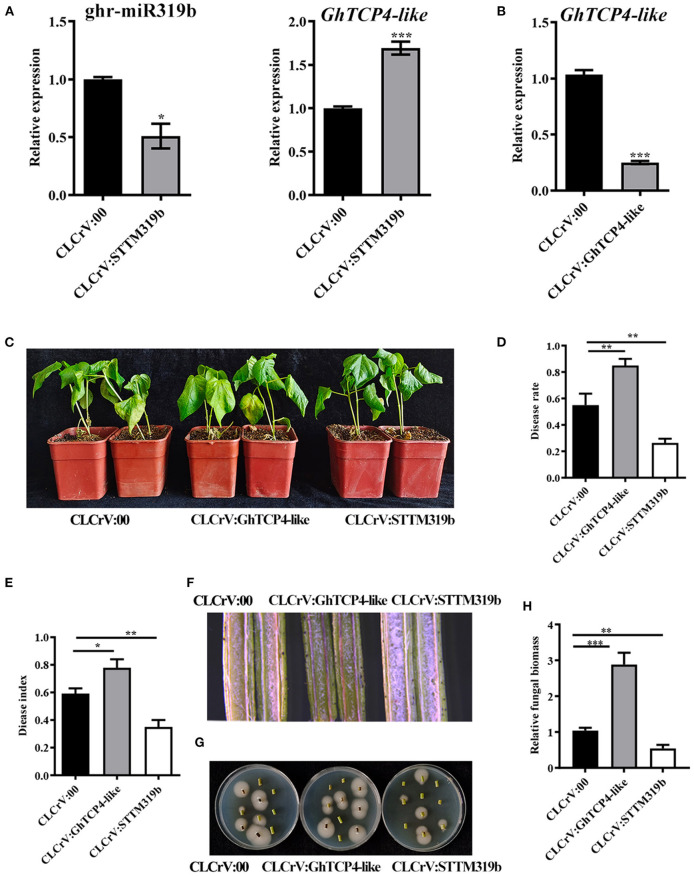
Figure 3.
Resistance analysis of ghr-miR319b and GhTCP4-like against V. dahlia. (A) Transcript level of ghr-miR319b and GhTCP4-like in the control and STTM plants determined by qPCR. Total RNA was extracted from the second true leaf 14 d after agroinfiltration. Error bar means SD of three independent biological replications. Student's t-test was performed, *p < 0.05, ***p < 0.001. (B) The transcript level of GhTCP4-like in control and GhTCP4-like-silenced plants was determined by qPCR. Error bar means SD of three independent biological replications. Student's t-test was performed, ***p < 0.001. (C) Disease symptom of CLCrV:00, CLCrV:GhTCP4-like and CLCrV:STTM319b plants were photographed at 14 dpi. (D,E) Disease rate and disease index were calculated at 14 dpi. More than 30 plants per treatment were sampled. Error bar means SD. Student's t-test was performed, *p < 0.05, **p < 0.01. (F) Color intensity of longitudinal sections of the stem of CLCrV:00, CLCrV:GhTCP4-like and CLCrV:STTM319b plants 14 dpi. Photos were taken by the body microscope. (G) Fungal discovery culture assay. V. dahliae growth condition on PDA medium from stems of CLCrV:00, CLCrV:GhTCP4-like, CLCrV:STTM319b plants 14 dpi. Photographs were taken after 5 days of culture at 25°C. (H) The relative fungal biomass assay. Stems from CLCrV:00, CLCrV:GhTCP4-like, CLCrV:STTM319b plants were used to extract DNA at 14 dpi, which were used as templates for relative fungal biomass analysis by qPCR. Error bar means SD of three independent biological replications. Student's t-test was performed, **p < 0.01, ***p < 0.001.

