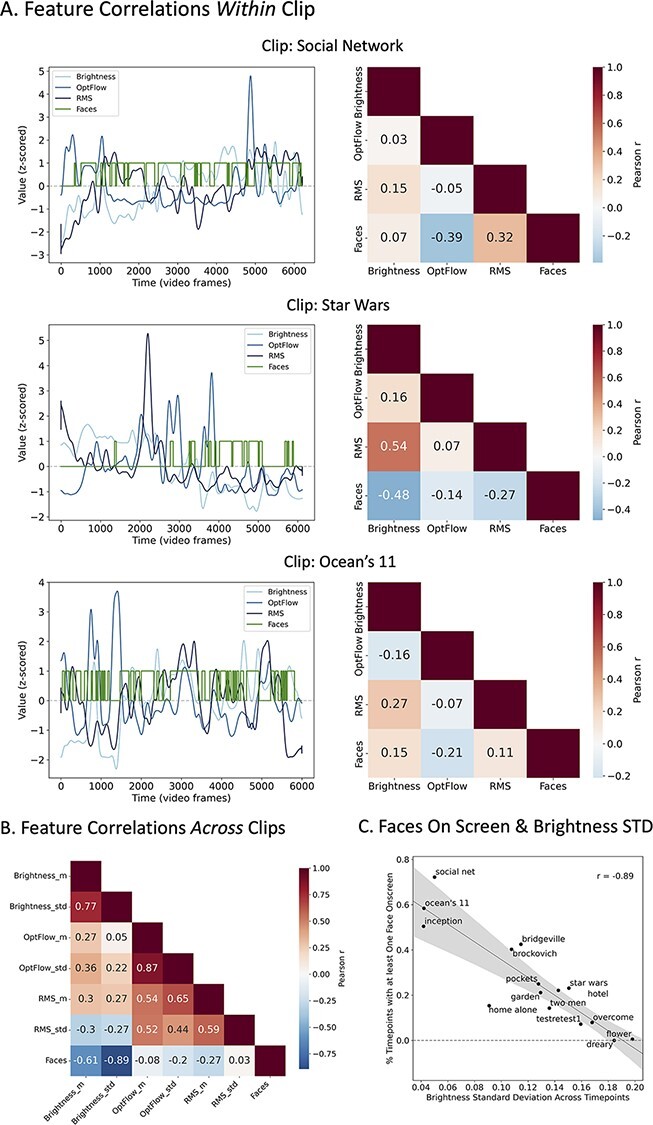
Fig. 2.

Example assessment of feature collinearity profiles to aid media selection using automatic feature extraction (pliers; McNamara et al., 2017). The following examples use a set of two- to four-minute movie clips from the Human Connectome Project 7 T acquisition (Van Essen et al., 2013) and extracted ‘faces on screen’ as a proxy for social content. (A) If an experimenter wanted to choose a media clip in which social content is minimally correlated with low-level features, they could extract these features (such as brightness, optical flow and audio root mean square or RMS) and assess the collinearity profiles within each clip across time. The correlation matrices show that in the Social Network clip, faces are associated with moments of louder audio and less motion, and in the Star Wars clip, the frames containing faces tend to be darker. The Ocean’s 11 clip shows the weakest collinearities between faces and low-level features (Low-level features [brightness, optical flow and audio RMS] have been smoothed with a Gaussian kernel and z-scored for visualization purposes.) (B) & (C) If an experimenter wants to use a variety of video clips, they can also assess collinearities across clips to determine, say, whether videos with higher social content (averaged across time) also have certain low-level properties that distinguish them from videos with lower social content. In the above example, there is a strong negative relationship between social content and the standard deviation in brightness such that clips higher in social content tend to be darker overall and to fluctuate less in brightness across frames. This analysis was inspired by and adapted with permission from Finn and Bandettini (2021).
