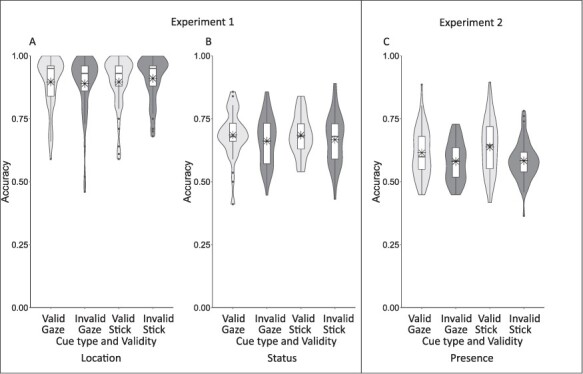
Fig. 2.

Results from Experiments 1 and 2 showing location accuracy (A) and status accuracy (B) for Experiment 1, and presence accuracy for Experiment 2 (C) plotted as a function of cue validity. Boxplots indicate the median and quartiles (whiskers 1.5 times interquartile range), violin overlay shows the full distribution of the data (kernel probability density), and mean is marked by an asterisk.
