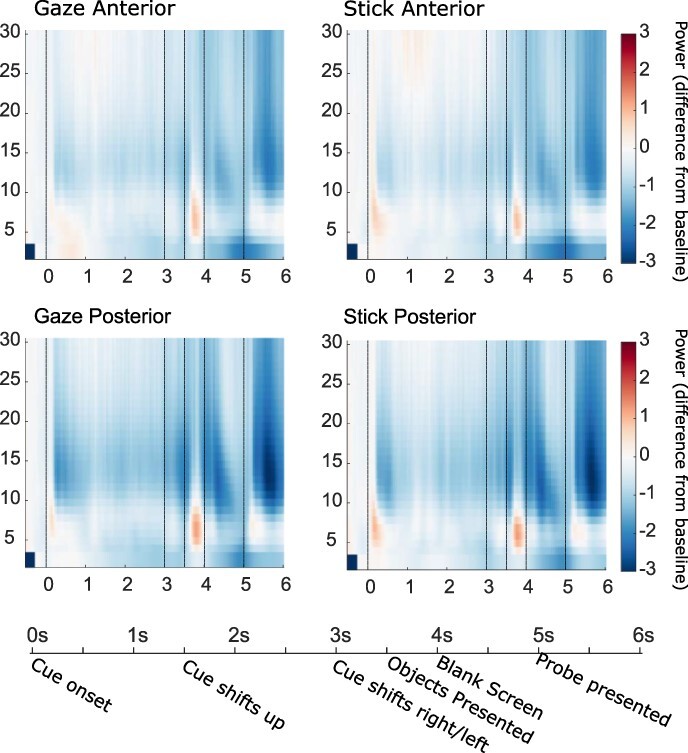
Fig. 3.

Figure shows time frequency (TFR) plots for oscillatory power (db baseline corrected −500–−100 ms) during the social avatar and the non-social stick condition, collapsed across validity conditions for anterior (Fp1, Fpz, Fp2, AF7, AF3, AF4, AF8, F7, F5, F3, F1, Fz, F2, F4, F6, F8, FT7, FC5, FC3, FC1, FCz, FC2, FC4, FC6 and FT8) and posterior (TP7, CP5, CP3, CP1, CP2, CP4, CP6, TP8, P7, P5, P3, P1, Pz, P2, P4, P6, P8, PO7, PO5, PO3, POz, PO4, PO6, PO8, O1, Oz and O2) electrodes separately. Timeline shows key experimental events and the crucial time points indicated on the TFRs are the trial start at 0 ms, cue shift at 3 s, the target onset at 3.5 s, target offset at 4 s and the probe onset at 5 s.
