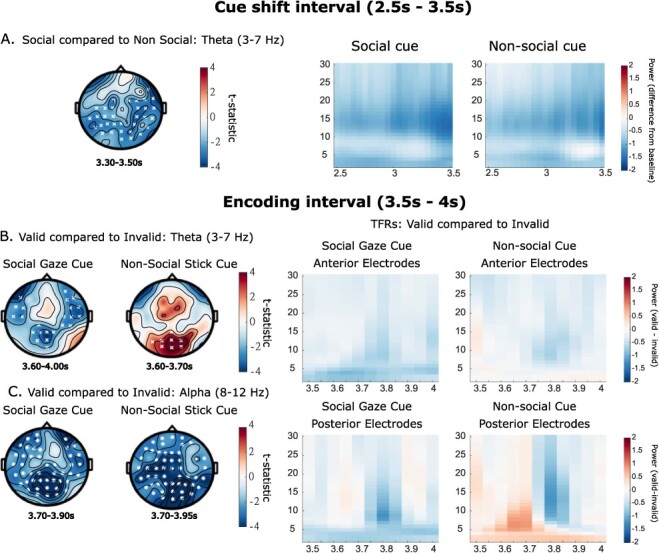
Fig. 4.

The left side of the figure shows representative cluster plots, full plots of effects across the time window are in Supplementary materials (Figure 1). The right side shows associated TFRs (db baseline corrected −500 to −100 ms). In Plot A the social gaze and non-social stick cue are contrasted during the initial cue shift window (theta effects only); the associated TFR is plotted over all electrodes. Valid and invalid conditions are contrasted for each cue separately in the encoding window; B shows theta band effects and C shows alpha band effects. In associated TFR plots, in the upper plots data show a snapshot of the anterior electrodes (Fp1, Fpz, Fp2, AF7, AF3, AF4, AF8, F7, F5, F3, F1, Fz, F2, F4, F6, F8, FT7, FC5, FC3, FC1, FCz, FC2, FC4, FC6 and FT8), and in the lower plots data are plotted over the electrodes that make up the significant posterior clusters in B (Social: CP1, P3, Pz, POz, P1, P2, PO3 and Oz, Non-social: Pz, POz, O1, O2, PO5, PO3, PO4, PO6 and Oz). Note that these plots are created by subtracting the invalid from the valid power-spectrum data, thus they show the difference between the conditions. Cluster significance levels from a two-tailed test are indicated as x P < 0.05, ✱ P < 0.01.
