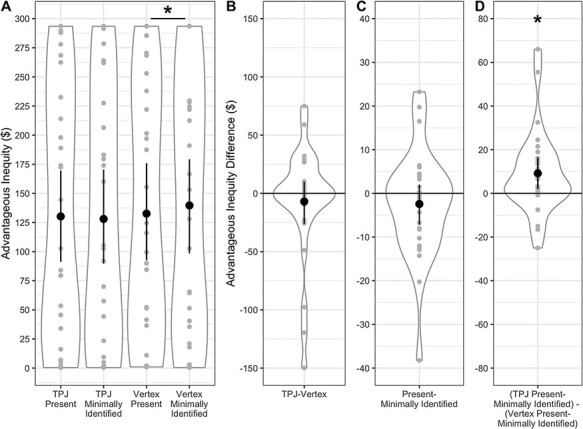
Fig. 3.

Advantageous inequity, by TMS and social condition. Note that plots of choice behavior in each of the four conditions emphasize the variability between participants due to known individual differences in social preferences (e.g. Morishima et al., 2012; Yamagishi et al., 2014). For this reason, we also present the within-subjects comparisons on which inference is based in our within-subjects design. (A) Advantageous inequity, summed by condition. Maximum advantageous inequity in a given condition is $293.50. All participants created at least some advantageous inequity in each condition (i.e. all graphed values are greater than 0). Condition differences for the main effect of TMS target (B), main effect of social condition (C) and TMS target by social condition interaction (D). A significant TMS target by social condition interaction was driven by a significant difference between interaction partners in the vertex condition but not the TPJ condition. Individual participant data points, densities and means with bootstrapped 95% confidence intervals are displayed. *P < 0.05.
