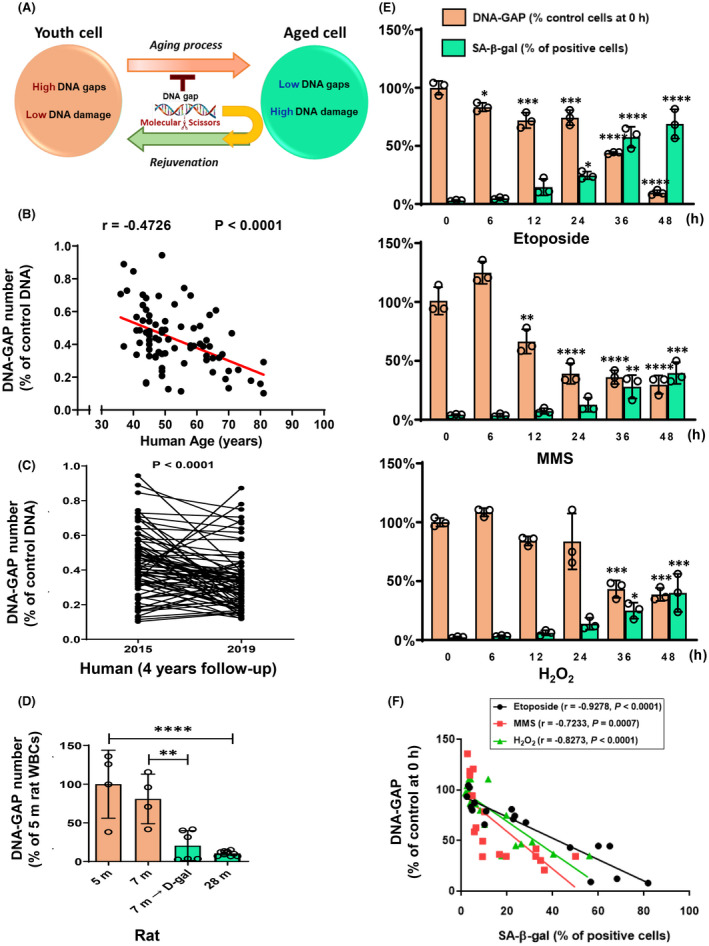
FIGURE 1.

Reduction in Youth‐DNA‐GAPs during chronological aging in mammals. We measured Youth‐DNA‐GAPs (DNA‐GAP) in healthy aging elderly, naturally aging rats, D‐galactose (D‐gal)‐induced aging rats, and different chemicals‐caused senescent cells. (A) A diagram representing the homeostasis of DNA gaps and DNA damage. Molecular scissors represent DNA gap‐forming proteins. (B) Correlation between the number of DNA gaps and age (n = 80). Pearson's correlation coefficient (R) with the P‐value is indicated. (C) Youth‐DNA‐GAP levels at the 4‐year follow‐up (2015–2019) in the same person (n = 76). P‐value is indicated (paired t‐test). (D) The numbers of DNA gaps in 5‐month‐old (n = 4), 7‐month‐old (n = 4), 7‐month‐old D‐gal induced (n = 6), 30‐month‐old (n = 14) rats. (E) The relative percentage of DNA gaps and SA‐β‐gal‐positive cells in the cells exposed to 2.5 μM etoposide, 50 μM MMS, and 100 μM H2O2 at different time points from 0 to 48 h (each data point is the mean of six experiments under intra‐assay conditions). (F) Correlation between the number of DNA gaps and SA‐β‐gal‐positive cells. Pearson's correlation coefficient (r) with the P‐value is indicated. Data represented in (B) and (C) are the percentage of the number of DNA gaps of control DNA. The number of DNA gaps in senescent cells in 5‐month‐old rats (D) and at 0 h (E) was normalized to 100%. All experimental data were independent biological samples. (D) and (E) data represent mean ± SEM. *p ≤ 0.05, **p ≤ 0.01, ***p ≤ 0.001, ****p ≤ 0.0001 from one‐way ANOVA followed by post hoc analysis
