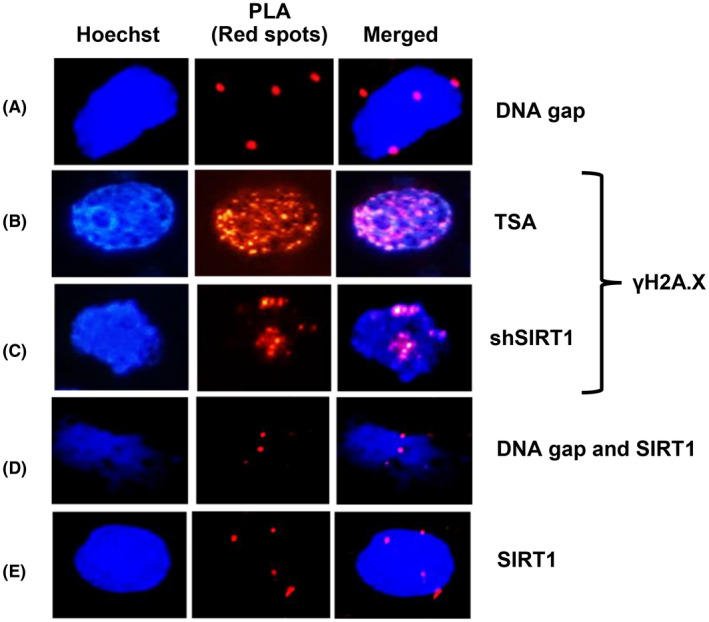
FIGURE 3.

Positive signals in colocalization experiment. HK2 cells transfected with Flag‐tagged Box A plasmid was applied for colocalization analysis with DI‐PLA or PLA indicated by the presence of red spots. The positive signals of colocalization between Flag‐tagged Box A and (A) DNA gaps, (B) γH2A.X of a cell treated with TSA, and (C) γH2A.X of a cell treated with shSIRT1, (D) representative colocalization staining of SIRT1 and DNA gaps and (E) SIRT1 and transfected Flag‐tagged Box A. All experimental data were independent biological samples
