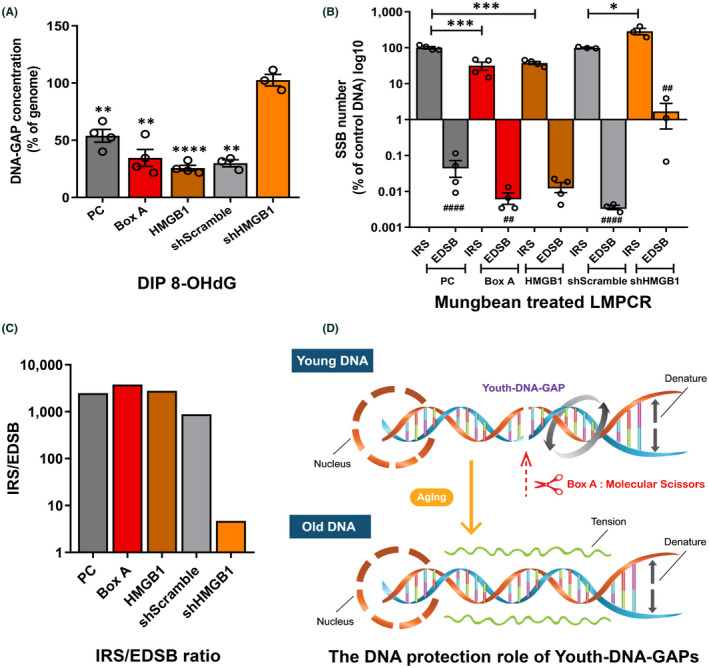
FIGURE 5.

Analysis of DNA damage presents around DNA gaps. DNA of Box A engineered cells were prepared. (A) DNA containing 8‐OHdG was selected by DIP. The concentration of 8‐OHdG‐linked EDSBs measured by DNA‐GAP PCR products from DIP. To calculate the percentage concentrations, the number of DNA gaps or EDSBs (DNA‐GAP number) of the representative genome was normalized to 100. (B) The data show comparisons of two SSB PCRs (IRS‐SSB PCR and EDSB‐SSB PCR) and between IRS‐SSB PCR of Box A‐ and HMGB1‐transfected cells and PC control or shHMGB1 cells and shScramble cells. (C) The IRS/EDSB ratio (proportion of IRS‐SSB PCR and EDSB‐SSB PCR product) in PC (control), Box A, HMGB1, shScramble, shHMGB1. (D) A diagram showing DNA tension with and without Youth‐DNA‐GAP. Data in (B) represent PCR levels of PC and shScramble groups normalized to 100%. Data represent mean ± SEM. *p ≤ 0.05, **p ≤ 0.01, ***p ≤ 0.001, ****p ≤ 0.0001 t‐test. ## p ≤ 0.01, ##### ≤0.0001 when comparing IRS vs. EDSB. All experimental data were independent biological samples
