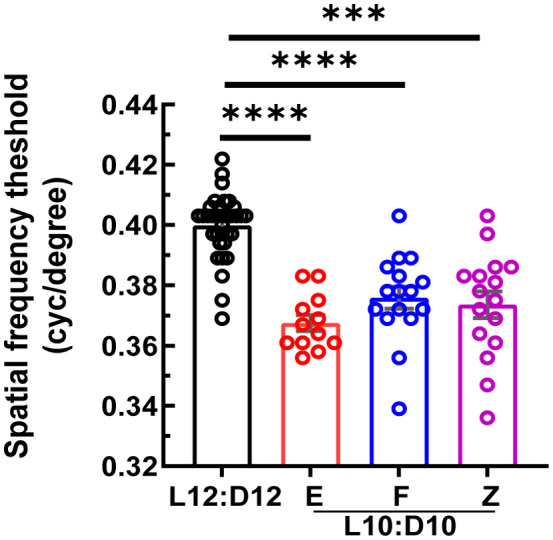
FIGURE 2.

Decrease in visual acuity under L10:D10 conditions: L10:D10 mice showed reduced visual acuity when measured using an optomotor response tracking system. Data from each eye is plotted. n = 17 (L12:D12), 6 (L10:D10 E), 8 (L10:D10 F), 8 (L10:D10 Z). Shown are mean ± SEM. ***p ≤ 0.001, **** p ≤ 0.0001 (ANOVA with Dunnett's post hoc test)
