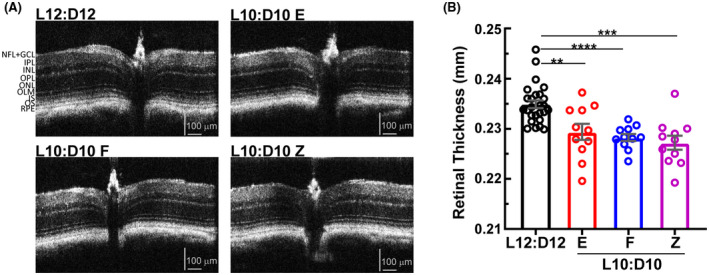
FIGURE 3.

Retinal thinning under L10:D10 conditions. Representative Spectral Domain‐Optical Coherence Tomography (SD‐OCT) B‐scans of the mouse retina (A), showing central optic nerve head and retinal sublayers. L10:D10 mice showed reduced total retinal thickness (B). n = 26 (L12:D12), 11 (L10:D10 E), 11 (L10:D10 F), (L10:D10 Z). Shown are mean ± SEM. **p ≤ 0.01, *** p ≤ 0.001, ****p ≤ 0.0001 (ANOVA with Dunnett's post hoc test)
