
FIGURE 6.
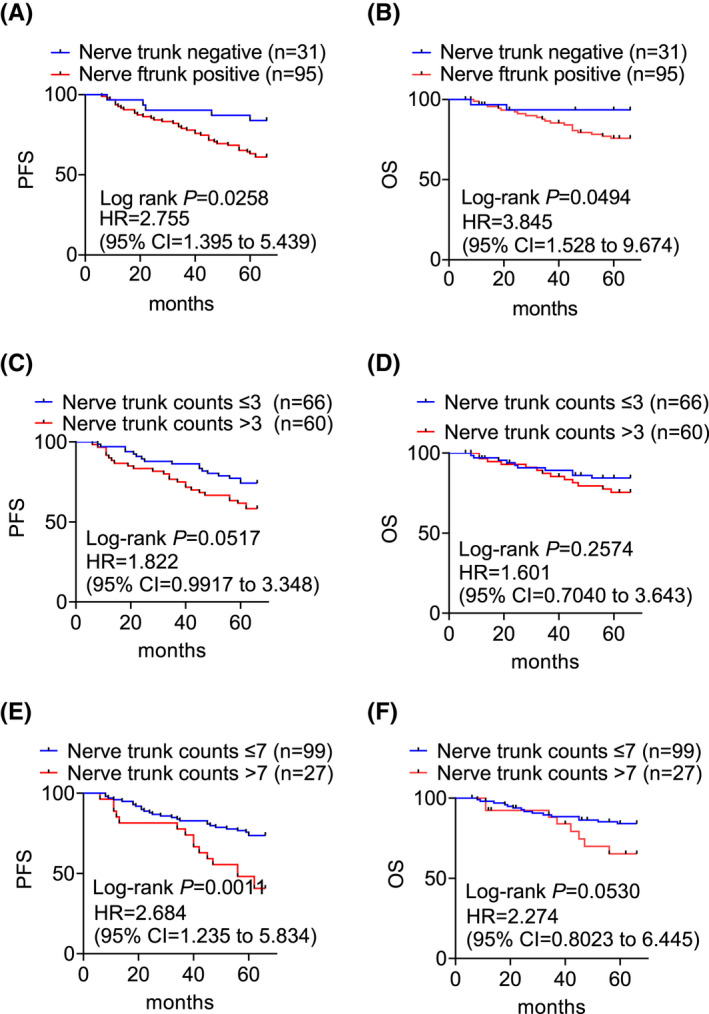
Log‐rank analysis of the probability of PFS and OS of patients of breast cancers with or without the presence of nerve trunks (A, B), with high or low densities of nerve trunks defined with the median (C, D) or high quartile (E, F) of nerve trunk counts as the cut‐off (C, D)