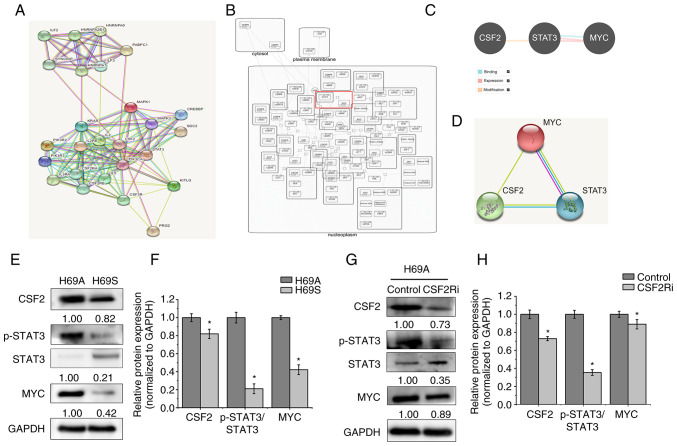
Figure 8.
CSF2 regulated phenotypic transformation through p-STAT3/MYC. (A) The STRING database was used to search for proteins that interact with CSF2. Known interactions are indicated with edges of pink (i.e., experimentally determined) and deep sky blue (i.e., database obtained). Predicted interactions are indicated with edges of green (i.e., gene neighborhood), blue (i.e., gene co-occurrence) and red (i.e., gene fusions). Edges of yellow indicate text-mining. Edges of black indicate co-expression. Edges of light purple indicate protein homology. (B) The Reactome database was used to analyze the regulatory relationship between MYC and STAT3. (C) The Pathway Commons database was used to analyze the relationship between CSF2, STAT3 and MYC. The relationship of binding (deep sky blue), expression (pink) and modification (orange) are shown. (D) The STRING database was used to analyze the regulatory relationship between CSF2, STAT3 and MYC. (E) The levels of CSF2, p-STAT3 and MYC in H69A and H69S cells were tested with western blotting. (F) Quantitative analysis of (E): H69A was the control (100%). Data are presented as the mean ± standard deviation of three independent experiments. (G) H69A was transfected with CSF2 shRNA and the expressions of CSF2, p-STAT3, STAT3 and MYC were detected by using western blotting. (H) Quantitative analysis of (G): H69A cells transfected with control plasmid were used as the control (100%). Data are presented as the mean ± standard deviation of three independent experiments. *P<0.05. p-STAT3, phosphorylated signal transducer and activator of transcription 3; CSF2, colony-stimulating factor 2.

