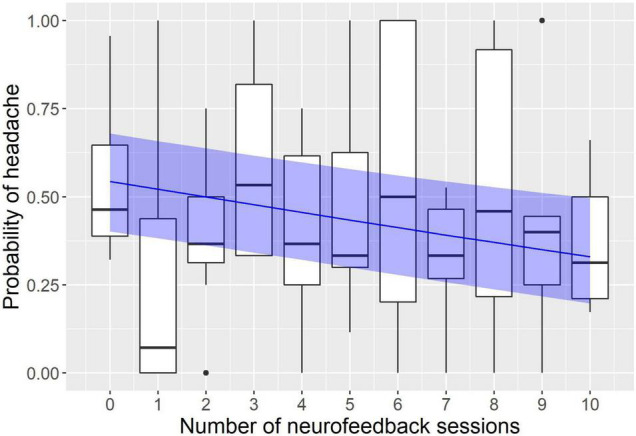
FIGURE 1.

Modeling of the influence of neurofeedback on the headache probability. The x axis represents the number of neurofeedback sessions the subject had to date; the y axis represents the probability to have a headache on a given day. Observed probabilities are shown by boxplots in black (the lower and upper hinges correspond to the first and third quartiles; the bold horizontal line corresponds to the median; the whiskers extend to the largest value no further than 1.5 inter-quartile range from the hinge; outliers are shown by dots). The probability predicted by the model is indicated by the blue line with a ribbon representing 95% confidence interval.
