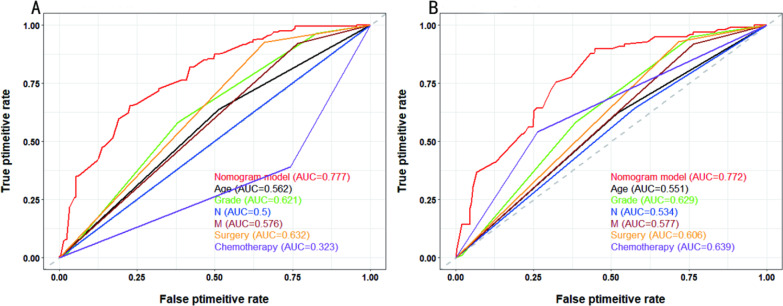
Fig. 2.
Correlation ROC curve analysis of prognostic models for advanced PBTC. Different colours represent different curves, where red, black, green, blue, brown, orange, and purple represent the nomogram model, age, grade, N, M, surgery, and chemotherapy, respectively. A In the training cohort, the AUC values for the nomogram, age, grade, N stage, M stage, surgery and chemotherapy were 0.777, 0.562, 0.621, 0.5, 0.576, 0.632 and 0.323, respectively. B In the validation cohort, the AUC values for the nomogram, age, grade, N stage, M stage, surgery and chemotherapy were 0.772, 0.551, 0.629, 0.534, 0.577, 0.606, and 0.639, respectively. ROC: receiver operating characteristic; AUC: area under the curve; PBTC: pancreatic body tail cancer

