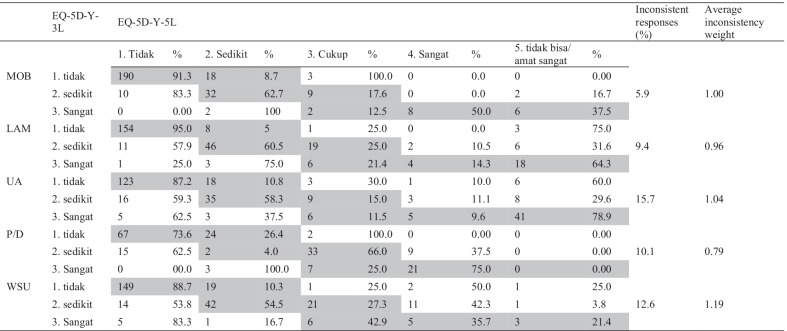
Table 3.
Cross tabulation for the Indonesian version of EQ-5D-Y-3L and EQ-5D-Y-5L (proxy)
MOB = mobility; LAM = looking after myself; UA = doing usual activities; P/D = having pain/discomfort; WSU = feeling worried/sad/unhappy
Tidak = no problems; sedikit = A little bit of problems; Cukup = some problems; sangat = a lot of problems; tidak bisa/amat sangat = extreme problems/can not
Grey cells represent consistent responses. The percentage of responses within consistent (grey) and inconsistent responses (white) were calculated separately. Thus, in the first row, 91.3% of the responses 1(3L) were validly distributed on 1(5L) and 8.7% on 2(5L). The inconsistent responses (%) is the percentage of response per dimension in the ‘white area’

