Fig. 1.
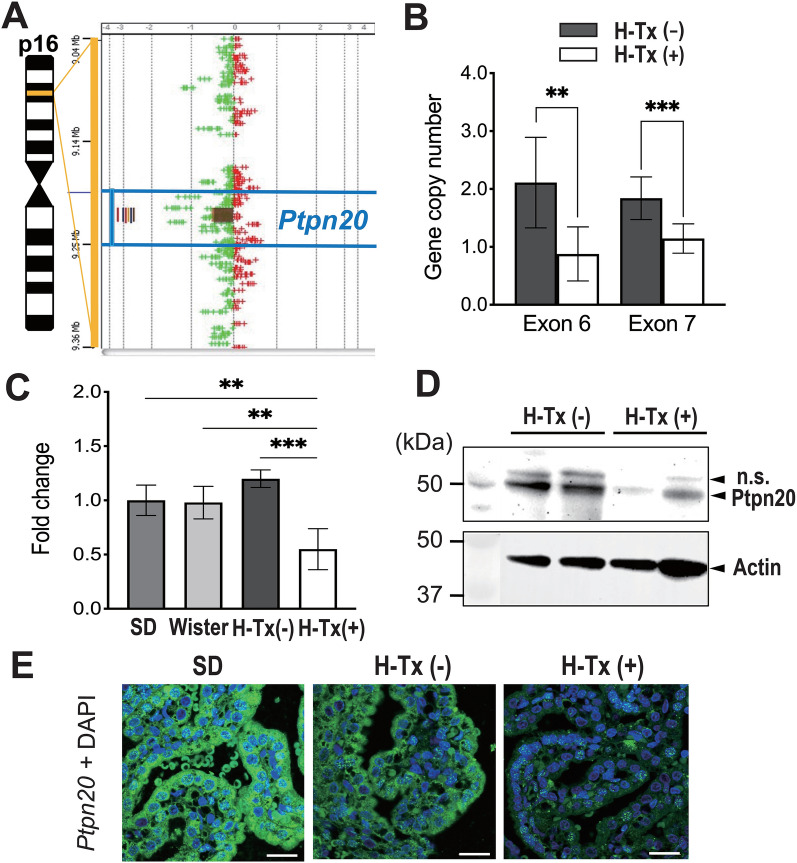
Identification and expression analysis of causative gene in H-Tx rats. A The log2 ratio value is plotted on the x-axis. The y-axis represents the genomic position of probes. Genomic profiles indicate a 14-kbp focal loss in 16p16. Colored vertical lines indicate the number of samples with copy number loss and loss segments (brown square) with respect to Ptpn20. B Real-time PCR of copy number in the Ptpn20 exon of H-Tx (−) and H-Tx (+) rats at E18. exon 6: H-Tx (−) = 2.11 ± 0.78, H-Tx (+) = 0.88 ± 0.47; exon 7: H-Tx (−) = 1.84 ± 0.37, H-Tx (+) = 1.15 ± 0.25 (mean ± standard deviation, **P < 0.01, ***P < 0.001; H-Tx (−) rats, n = 12; H-Tx (+) rats, n = 6). C Real-time PCR of RNAs from P1 rats in SD, Wistar, H-Tx (−) and H-Tx (+) groups to determine expression levels of Ptpn20 in the brain. Data are normalized to β-actin and fold change is expressed relative to levels in the SD rat. SD = 1.00 ± 0.14; Wistar = 0.98 ± 0.15; H-Tx (−) = 1.20 ± 0.08; H-Tx (+) = 0.55 ± 0.19 (mean ± standard deviation, **P < 0.01, ***P < 0.001; n = 5 rats per group). D Immunoblot analysis of Ptpn20 protein from the CP of P1 H-Tx (−) and H-Tx (+) rats. The 50-kDa bands correspond to Ptpn20 and nonspecific (n.s.) bands, respectively. Ptpn20 protein shows low or approximately abolished expression in H-Tx (+) rats. Actin was used as a loading control (n = 5 rats per group). E Immunofluorescence images of the CP in P1 SD, H-Tx (−) and H-Tx (+) rats are immunolabeled with anti-Ptpn20 (green) antibody and with DAPI (blue). Ptpn20 appears enriched in the CP epithelium of SD and H-Tx (−) rats, with low expression in H-Tx (+) rats, Scale bar = 20 μm

