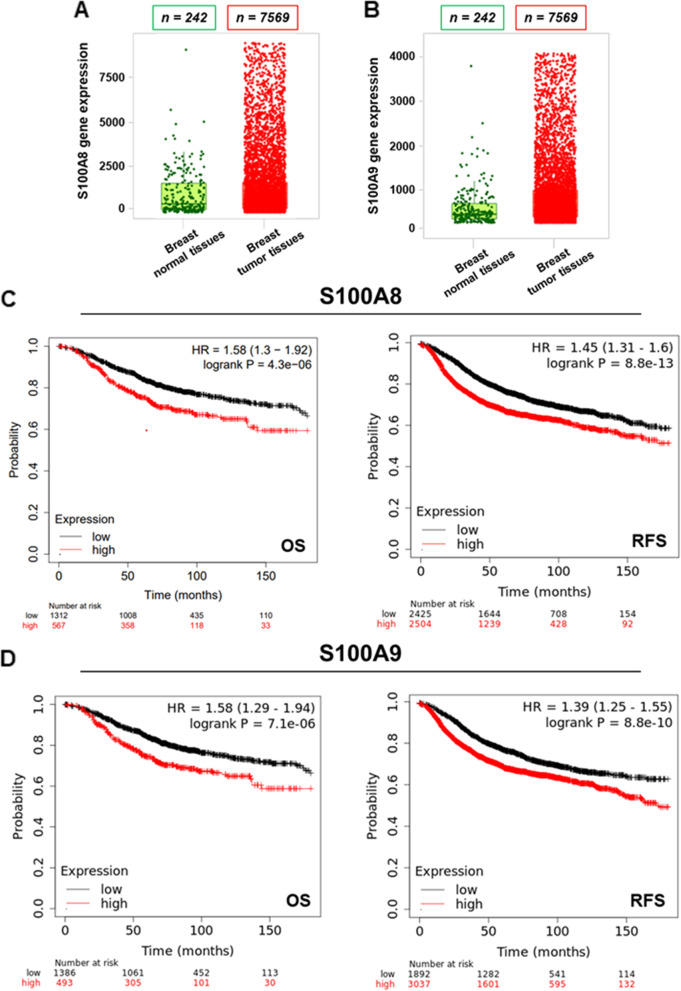
Fig. 1.
S100A8 and S100A9 are greatly expressed in primary breast tumors and correlate with poor clinical outcomes. A TNM box plot of S100A8 gene expression in normal and breast tumor tissues. B TNM box plot of S100A9 gene expression in normal and breast tumor tissues. C Kaplan-Meier Plotter Overall Survival (OS) (n = 1879) and Relapse Free Survival (RFS) (n = 4929) analysis in breast cancer subtypes harboring low and high levels of S100A8, respectively, at a follow up threshold of 180 months. Log-rank p-value is indicated within the boxes. All possible cutoff values between the lower and upper quartiles were automatically computed (i.e., auto select best cutoff on the website). Cutoff values used in the analysis were as follows: S100A8-OS: 3285; S100A8-RFS: 639. D Kaplan-Meier Plotter Overall Survival (OS) (n = 1879) and Relapse Free Survival (RFS) (n = 4929) in breast cancer subtypes harboring low and high levels of S100A9, respectively, at a follow up threshold of 180 months. Log-rank p-value is indicated within the boxes. All possible cutoff values between the lower and upper quartiles were automatically computed (i.e., auto select best cutoff on the website). Cutoff values used in the analysis were as follows: S100A9-OS: 2293; S100A9-RFS: 278

