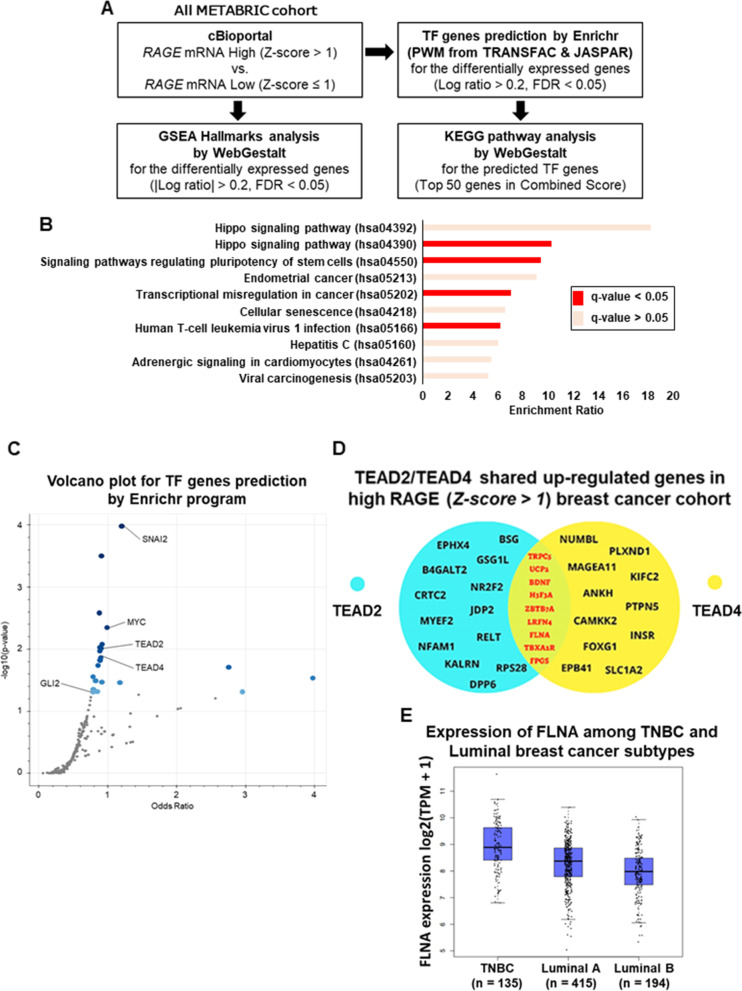
Fig. 4.
Hippo pathway is significantly enriched in high RAGE expression breast cancer cohort. A Differentially expressed genes (DEGs) between high (Z-score > 1) and low (Z-score ≤ 1) RAGE expression groups in breast cancer and estimation of GSEA Hallmark in DEGs using cBioportal and Webgestalt programs. B Putative significant pathways identified among the high RAGE (Z-score > 1) expression breast cancer group as indicated by the KEGG pathway analysis for the predicted TF genes based on the DEGs. C Volcano plot for TF genes prediction by Enrichr program in high RAGE (Z-score > 1) expression breast cancer cohort. The Volcano plot shows the significance of each potential TF gene predicted by Enrichr program based on the position weight matrices from JASPAR & TRANSFAC databases. The x-axis measures the odds ratio (0, inf) calculated for the TF genes, while the y-axis gives the -log10 (p-value) of the TF genes. Larger blue points represent significant TF genes (p-value < 0.05); smaller gray points represent non-significant TF genes. The darker blue color points means the highest significance. D Venn diagram of the shared up-regulated genes by TEAD2 and TEAD4 Hippo pathway TFs in high RAGE (Z-score > 1) expression breast cancer cohort. E Gene Expression Profiling Interactive Analysis (GEPIA) box plot of FLNA expression levels in TNBC, Luminal-A and Luminal-B breast cancer subtypes

