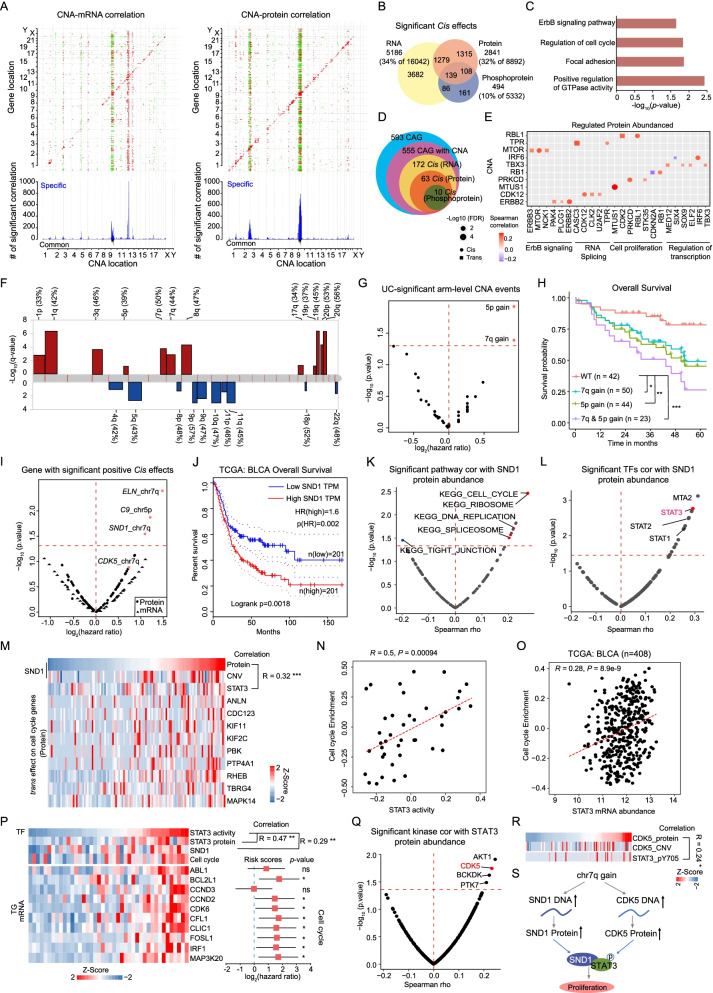
Fig. 2.
Effects of copy number alterations on mRNA and protein abundance. A Functional effects of CNAs on mRNA and proteins. Top panels: correlation of CNA to mRNA and protein abundance. Positive and negative correlations are indicated in red and blue, respectively. Genes were ordered by chromosomal location on the x and y axes. Diagonal lines indicate cis-effects of CNA on mRNA or proteins. Bottom panels: number of mRNAs or proteins that were significantly associated with a specific CNA. Gray bars indicate correlations specific to mRNA or proteins, and black bars indicate correlations with both mRNA and proteins. B Venn diagrams depicting the cascading effects of CNAs. It shows the overlap between significant cis events across the transcriptome, proteome, and phosphoproteome. C Pathways enriched for 139 significant cis-effect genes. D Venn diagram shows the significant cis events restricted to cancer-associated genes (CAGs) across multiple data types. E Cis- and trans-effects of 10 significant cis-effect CAGs. Affected proteins are grouped by pathway. F Arm-level CNAs. Red denotes amplification and blue denotes deletion. G Chromosomal alterations associated with prognosis (overall survival). Volcano plot showing log2-based hazard ratio for each alterative chromosome. H Overall survival analysis of patients with 5p or 7q gain versus WT (p value from log-rank test). I Volcano plot showing log2-based hazard ratio (overall survival) for significant positive cis-effect genes on chromosomes 5p and 7q, respectively. The dots represent proteins, and the triangles represent mRNA. J Overall survival analyses of BLCA TCGA patients with high or low levels of SND1 mRNA abundance (p value from log-rank test). K Volcano plot showing the correlation between enriched KEGG pathways scores (sample-specific gene set enrichment analysis (ssGSEA)) and SND1 protein abundance. L Volcano plot showing the correlation of transcription factors (TFs) with SND1 based on protein level. TF, highlighted in red, reportedly interacts with SND1. M Heatmap of SND1 protein abundance and trans-effect cell-cycle-related proteins. N Correlation of STAT3 activity with the cell cycle enrichment score by ssGSEA. O Correlation of STAT3 with the cell cycle enrichment score by ssGSEA in TCGA cohort. P Heatmap of STAT3 activity change and the target genes of STAT3 that participated in cell cycle. Confidence intervals (95%) of hazard ratio coefficients (overall survival) for each gene mRNA expression level were based on multivariate Cox regression models (tumor samples, n = 42). Q Volcano plot showing the correlation of kinase with STAT3 based on protein level. The kinase highlighted in red has been reported to be a STAT3 kinase. R Correlation and heatmap of CDK5 protein abundance with STAT3 phosphorylation change. S A model depicting the gain of chromosome 7q. The p values in K–R were calculated by Spearman's correlation test

