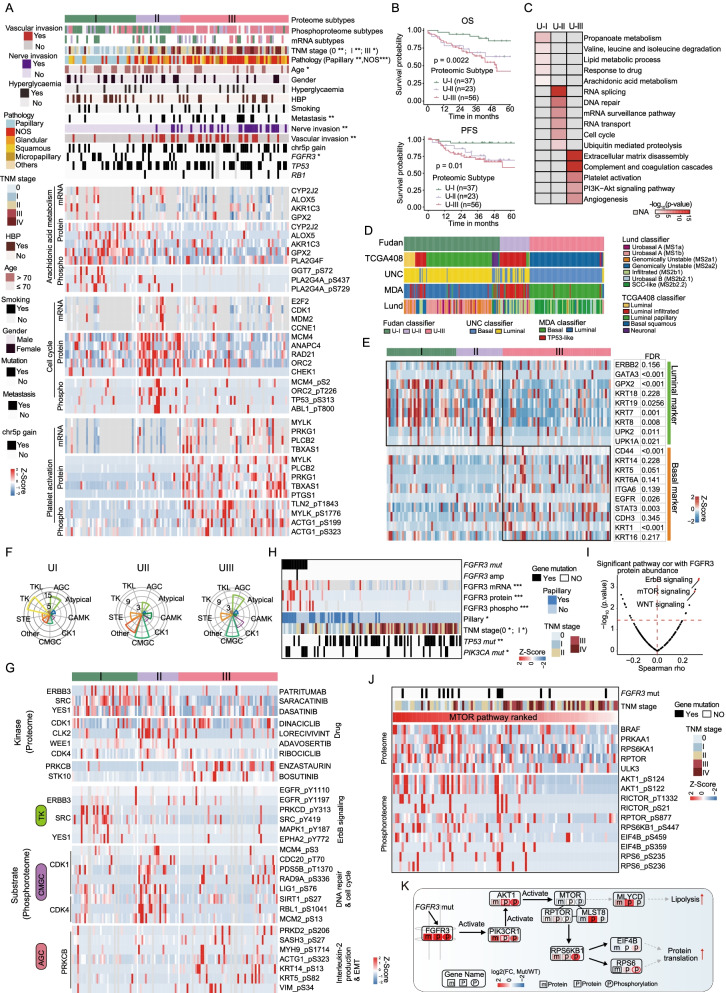
Fig. 5.
Proteomic subtypes of UC and signature proteins. A Heatmap of differentially regulated proteins among the proteomic subtypes (Kruskal–Wallis test, p < 0.05), annotated with clinical features. Fisher’s exact test was used for categorical variables: age, gender, hyperglycosemia, HBP, smoking status, metastasis status, status of FGFR3/TP53/RB1 mutation, pathological subtypes, differentiation, and TNM stage. B Kaplan–Meier curves for overall survival and progression-free survival of different proteomic subgroups (p value from log-rank test). C Pathways significantly enriched in the proteomic subtypes. D Comparisons between our classifier and other classifiers. E Luminal markers were enriched in the UI and UII subtypes, while basal markers were enriched in the UIII subtype (Wilcoxon rank-sum test, p < 0.05). F The kinase family was enriched in different proteomic subtypes (Kruskal–Wallis test, p < 0.05). G Representative kinase and its phosphorylation sites enriched in different proteomic subtypes (Kruskal–Wallis test, p < 0.05). H The expression of FGFR3 in patients with or without FGFR3 mutation. I The pathways correlated with FGFR3 protein abundance. J Ranked co-phosphorylation signature of the mTOR pathway aligned with clinical features. K Summary of key FGFR3 mutation associated

