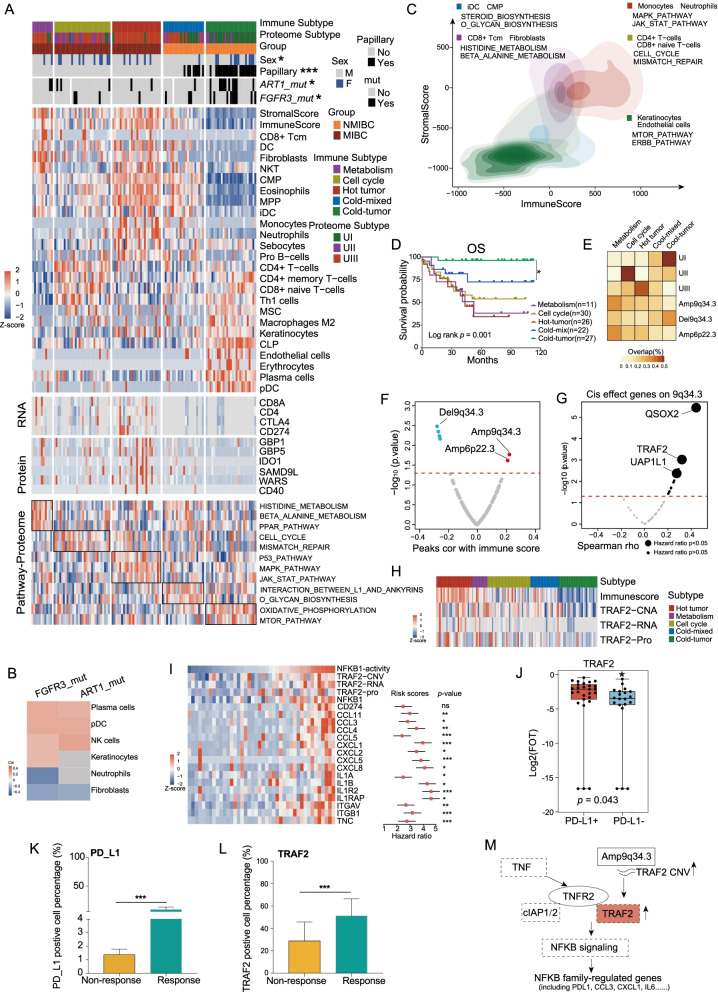
Fig. 6.
Immune cell infiltration in UC tumors. A Heatmap illustrating cell-type compositions and activities of selected individual gene/proteins and pathways across the five immune clusters. The heatmap in the first section illustrates the immune/stromal signatures from xCell. The mRNA and protein abundance of key immune-related markers and ssGSEA scores based on global proteomics data for biological pathways upregulated in different immune groups are illustrated in the remaining sections. B xCell immune/stromal signatures in FGFR3 or ART1 mutations compared with WT. C Contour plot of two-dimensional density based on immunes core (y-axis) and stromal scores (x-axis) for different immune clusters. For each immune cluster, key upregulated pathways are enriched based on global proteomics (Kruskal–Wallis test, p < 0.05). D Kaplan–Meier curves for overall survival of different immune clusters (p value from log-rank test). E Heatmap of the comparison between immune clusters (columns) with proteomic subtypes and different peak events. Each row sums to one, with different blocks showing the proportion of tumors belonging to different immune clusters. F Volcano plot showing the correlation between different peak events and immune score. G Volcano plot showing the cis-effect genes on 9q34.3 (Spearman’s correlation coefficients, p < 0.05). Bigger bubbles showing genes with significant hazard ratio. H Heatmap showing the copy number alter, mRNA abundance, protein abundance of TRAF2. I Heatmap showing the estimated NFKB1 activity and the mRNA abundance of the targets, the middle red points indicate hazard ratios for each protein, and the endpoints represent lower or upper 95% confidence intervals. J TRAF2 was differentially expressed in PD-L1+ group and PD-L1-group. K–L Boxplots show the quantification of the IHC results. M A model depicting the multi-level regulation of TRAF2 copy number alterations

