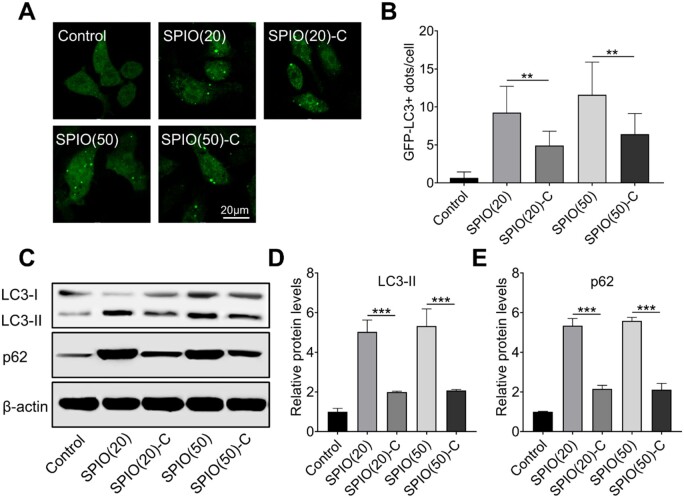
Figure 2.
Characterization of SPIO nanoparticle induced macrophage autophagy. (A) CLSM image of fluorescent autophagosome in Raw264.7 with stably expression of GFP-LC3 after treated with SPIO nanoparticles for 24 h. (B) Statistical analysis of GFP-LC3+ puncta in Raw264.7 cells. (C) Western blotting of LC3 and p62 in Raw264.7 treated with SPIO nanoparticles for 24 h, β-actin was detected as a loading control. Densitometry analysis for quantifying the levels of LC3-II (D) and p62 (E) values are expressed as the mean, n ≥ 3. Bars show SD. **P < 0.01; ***P < 0.001

