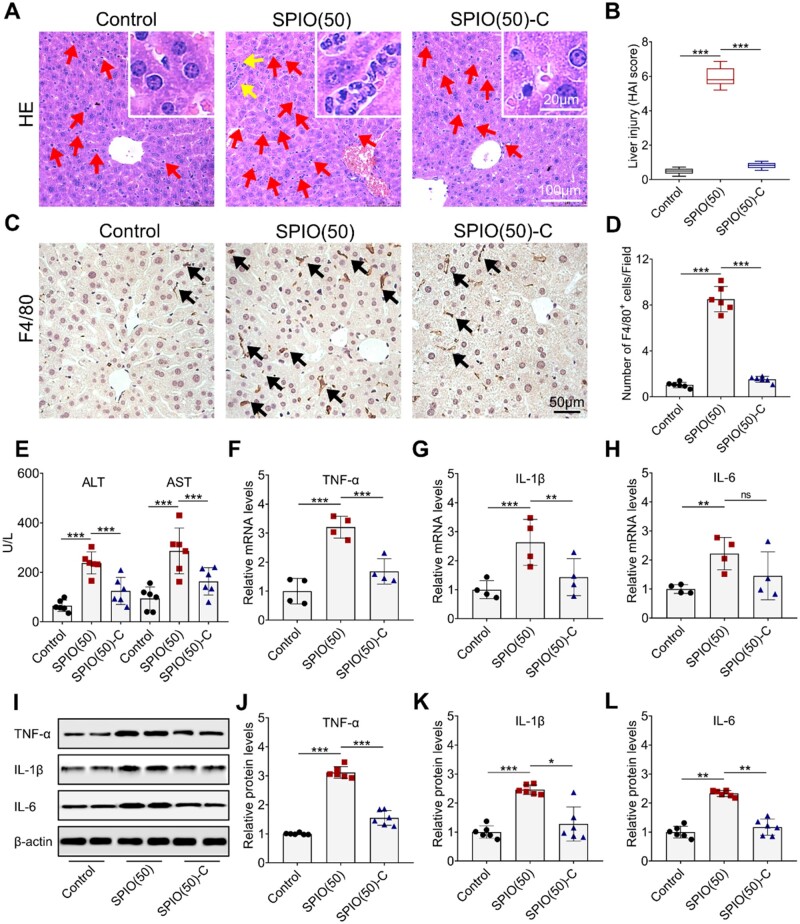
Figure 6.
Effects of SP IO nanoparticles on the liver inflammation. (A) HE staining of liver section (Kupffer cells and the focal necrosis of hepatocytes are marked by arrows; the partial enlarged image is placed in the upper right corner). (B) Analysis of liver injury by HAI. (C) F4/80 staining of liver section (macrophages with high expression of F4/80 are marked by arrows). (D) Quantification of F4/80+ cells. (E) Evaluation of ALT and AST to determine the degree of liver injury. Expression of T NF-α (F), IL-1β (G) and IL-6 (H) in the liver detected by RT-qP CR. (I) Western blot analysis of T NF-α, IL-1β and IL-6 in the liver treated with SP IO nanoparticles for 24 h, β-actin was detected as a loading control. Densitometry analysis for quantifying the levels of T NF-α (J), IL-1β (K) and IL-6 (L). Values are expressed as the mean, n ≥ 4. Bars show SD. *P < 0.05; **P < 0.01; ***P < 0.001; ns, not significant

